![]()
UPD 5/03/15: Внимание! Cloudmouse закрылся!
Всем пользователям настоятельно рекомендовано с срочном порядке запрашивать резервные копии у службы поддержки.
Итак, продолжим обзор начатый в первом посте.
Начнем с того что при проверке на 2ip.ru ip-адреса выделенного моему виртуальному серверу я немного удивился. В GeoIP он помечен вот так:
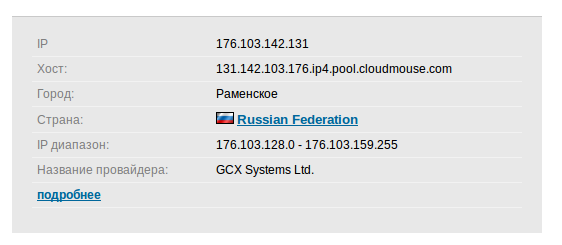
Сервера то в Голландии ). Но в принципе это мелочь на которую не стоит обращать внимание. В связи с исчерпанием ipv4 многие неиспользуемые диапазоны ip-адресов стали пускаться в ход.
Сервер для тестов я взял как обычно по минимальному тарифу (3.60$ в месяц).
Вот результаты тестов
Пинги из Ульяновска:
➜  ping 176.103.142.131
PING 176.103.142.131 (176.103.142.131) 56(84) bytes of data.
64 bytes from 176.103.142.131: icmp_seq=1 ttl=54 time=280 ms
64 bytes from 176.103.142.131: icmp_seq=2 ttl=54 time=153 ms
64 bytes from 176.103.142.131: icmp_seq=3 ttl=54 time=93.9 ms
64 bytes from 176.103.142.131: icmp_seq=4 ttl=54 time=102 ms
64 bytes from 176.103.142.131: icmp_seq=5 ttl=54 time=93.2 ms
64 bytes from 176.103.142.131: icmp_seq=6 ttl=54 time=94.1 ms
64 bytes from 176.103.142.131: icmp_seq=7 ttl=54 time=97.8 ms
64 bytes from 176.103.142.131: icmp_seq=8 ttl=54 time=115 ms
64 bytes from 176.103.142.131: icmp_seq=9 ttl=54 time=91.7 ms
64 bytes from 176.103.142.131: icmp_seq=10 ttl=54 time=275 ms
64 bytes from 176.103.142.131: icmp_seq=11 ttl=54 time=319 ms
64 bytes from 176.103.142.131: icmp_seq=12 ttl=54 time=93.0 ms
64 bytes from 176.103.142.131: icmp_seq=13 ttl=54 time=98.0 ms
^C
--- 176.103.142.131 ping statistics ---
13 packets transmitted, 13 received, 0% packet loss, time 12011ms
rtt min/avg/max/mdev = 91.740/146.880/319.596/81.611 ms
Для начала посмотрим что у нас за дистрибутив:
ubuntu@server17926:~$ cat /etc/issue
Ubuntu 14.04.1 LTS \n \l
Потом глянем на процессор и память:
ubuntu@server17926:~$ cat /proc/cpuinfo
processor    : 0
vendor_id    : GenuineIntel
cpu family    : 15
model        : 6
model name    : Common KVM processor
stepping    : 1
microcode    : 0x1
cpu MHz        : 2599.998
cache size    : 4096 KB
physical id    : 0
siblings    : 1
core id        : 0
cpu cores    : 1
apicid        : 0
initial apicid    : 0
fpu        : yes
fpu_exception    : yes
cpuid level    : 5
wp        : yes
flags        : fpu de pse tsc msr pae mce cx8 apic sep mtrr pge mca cmov pat pse36 clflush mmx fxsr sse sse2 syscall nx lm constant_tsc nopl pni cx16 x2apic hypervisor
bogomips    : 5199.99
clflush size    : 64
cache_alignment    : 128
address sizes    : 40 bits physical, 48 bits virtual
power management:
ubuntu@server17926:~$ cat /proc/meminfo
MemTotal:         501676 kB
MemFree:           10504 kB
Buffers:            6108 kB
Cached:           375060 kB
SwapCached:            0 kB
Active:           273916 kB
Inactive:         170988 kB
Active(anon):      63956 kB
Inactive(anon):    11716 kB
Active(file):     209960 kB
Inactive(file):   159272 kB
Unevictable:           0 kB
Mlocked:               0 kB
SwapTotal:             0 kB
SwapFree:              0 kB
Dirty:                 0 kB
Writeback:             0 kB
AnonPages:         63768 kB
Mapped:            20180 kB
Shmem:             11932 kB
Slab:              33540 kB
SReclaimable:      24976 kB
SUnreclaim:         8564 kB
KernelStack:         776 kB
PageTables:         5264 kB
NFS_Unstable:          0 kB
Bounce:                0 kB
WritebackTmp:          0 kB
CommitLimit:      250836 kB
Committed_AS:     611824 kB
VmallocTotal:   34359738367 kB
VmallocUsed:        1228 kB
VmallocChunk:   34359732183 kB
HardwareCorrupted:     0 kB
AnonHugePages:         0 kB
HugePages_Total:       0
HugePages_Free:        0
HugePages_Rsvd:        0
HugePages_Surp:        0
Hugepagesize:       2048 kB
DirectMap4k:       20352 kB
DirectMap2M:      503808 kB
Замерим скорость линейной записи на диск:
ubuntu@server17926:~$ dd if=/dev/zero of=test bs=64k count=16k conv=fdatasync
16384+0 records in
16384+0 records out
1073741824 bytes (1.1 GB) copied, 5.38423 s, 199 MB/s
Весьма недурно, где-то на среднем уровне среди протестированных серверов.
Тесты sysbench для тех кому это интересно:
ubuntu@server17926:~$ sysbench --test=cpu --cpu-max-prime=20000 --num-threads=4 run
sysbench 0.4.12:  multi-threaded system evaluation benchmark

Running the test with following options:
Number of threads: 4

Doing CPU performance benchmark

Threads started!
Done.

Maximum prime number checked in CPU test: 20000


Test execution summary:
    total time:                          35.0733s
    total number of events:              10000
    total time taken by event execution: 140.2234
    per-request statistics:
         min:                                  3.25ms
         avg:                                 14.02ms
         max:                                 39.38ms
         approx.  95 percentile:              16.56ms

Threads fairness:
    events (avg/stddev):           2500.0000/1.22
    execution time (avg/stddev):   35.0558/0.01
ubuntu@server17926:~$ sysbench --test=cpu --cpu-max-prime=20000 --num-threads=1 run
sysbench 0.4.12:  multi-threaded system evaluation benchmark

Running the test with following options:
Number of threads: 1

Doing CPU performance benchmark

Threads started!
Done.

Maximum prime number checked in CPU test: 20000


Test execution summary:
    total time:                          33.8911s
    total number of events:              10000
    total time taken by event execution: 33.8869
    per-request statistics:
         min:                                  3.26ms
         avg:                                  3.39ms
         max:                                  6.00ms
         approx.  95 percentile:               3.66ms

Threads fairness:
    events (avg/stddev):           10000.0000/0.00
    execution time (avg/stddev):   33.8869/0.00
ubuntu@server17926:~$ sysbench --test=threads --thread-locks=1 --max-time=20s run
sysbench 0.4.12:  multi-threaded system evaluation benchmark

Running the test with following options:
Number of threads: 1

Doing thread subsystem performance test
Thread yields per test: 1000 Locks used: 1
Threads started!
Done.

Test execution summary:
    total time:                          2.8439s
    total number of events:              10000
    total time taken by event execution: 2.8401
    per-request statistics:
         min:                                  0.27ms
         avg:                                  0.28ms
         max:                                  1.32ms
         approx.  95 percentile:               0.36ms

Threads fairness:
    events (avg/stddev):           10000.0000/0.00
    execution time (avg/stddev):   2.8401/0.00
ubuntu@server17926:~$ sysbench --test=mutex --num-threads=64 run
sysbench 0.4.12:  multi-threaded system evaluation benchmark

Running the test with following options:
Number of threads: 64

Doing mutex performance test
Threads started!
Done.


Test execution summary:
    total time:                          0.1822s
    total number of events:              64
    total time taken by event execution: 6.5856
    per-request statistics:
         min:                                  2.76ms
         avg:                                102.90ms
         max:                                167.99ms
         approx.  95 percentile:             167.35ms

Threads fairness:
    events (avg/stddev):           1.0000/0.00
    execution time (avg/stddev):   0.1029/0.06
ubuntu@server17926:~$ sysbench --test=memory --num-threads=4 --memory-total-size=512M run
sysbench 0.4.12:  multi-threaded system evaluation benchmark

Running the test with following options:
Number of threads: 4

Doing memory operations speed test
Memory block size: 1K

Memory transfer size: 512M

Memory operations type: write
Memory scope type: global
Threads started!
Done.

Operations performed: 524288 (1130640.50 ops/sec)

512.00 MB transferred (1104.14 MB/sec)


Test execution summary:
    total time:                          0.4637s
    total number of events:              524288
    total time taken by event execution: 1.3691
    per-request statistics:
         min:                                  0.00ms
         avg:                                  0.00ms
         max:                                 20.03ms
         approx.  95 percentile:               0.00ms

Threads fairness:
    events (avg/stddev):           131072.0000/1550.66
    execution time (avg/stddev):   0.3423/0.01

ubuntu@server17926:~$ sysbench --test=fileio --file-total-size=4G prepare
sysbench 0.4.12:  multi-threaded system evaluation benchmark

128 files, 32768Kb each, 4096Mb total
Creating files for the test...
ubuntu@server17926:~$ sysbench --test=fileio --file-total-size=4G --file-test-mode=rndrw --max-time=300 --max-requests=0 runsysbench 0.4.12:  multi-threaded system evaluation benchmark

Running the test with following options:
Number of threads: 1

Extra file open flags: 0
128 files, 32Mb each
4Gb total file size
Block size 16Kb
Number of random requests for random IO: 0
Read/Write ratio for combined random IO test: 1.50
Periodic FSYNC enabled, calling fsync() each 100 requests.
Calling fsync() at the end of test, Enabled.
Using synchronous I/O mode
Doing random r/w test
Threads started!
Time limit exceeded, exiting...
Done.

Operations performed:  17080 Read, 11386 Write, 36352 Other = 64818 Total
Read 266.88Mb  Written 177.91Mb  Total transferred 444.78Mb  (1.482Mb/sec)
   94.85 Requests/sec executed

Test execution summary:
    total time:                          300.1245s
    total number of events:              28466
    total time taken by event execution: 112.8247
    per-request statistics:
         min:                                  0.00ms
         avg:                                  3.96ms
         max:                                690.15ms
         approx.  95 percentile:              14.85ms

Threads fairness:
    events (avg/stddev):           28466.0000/0.00
    execution time (avg/stddev):   112.8247/0.00
Также я проводил тест утилитой от serverbear
Результаты тестов с serverbear.com
Тест с 1С-Битрикс
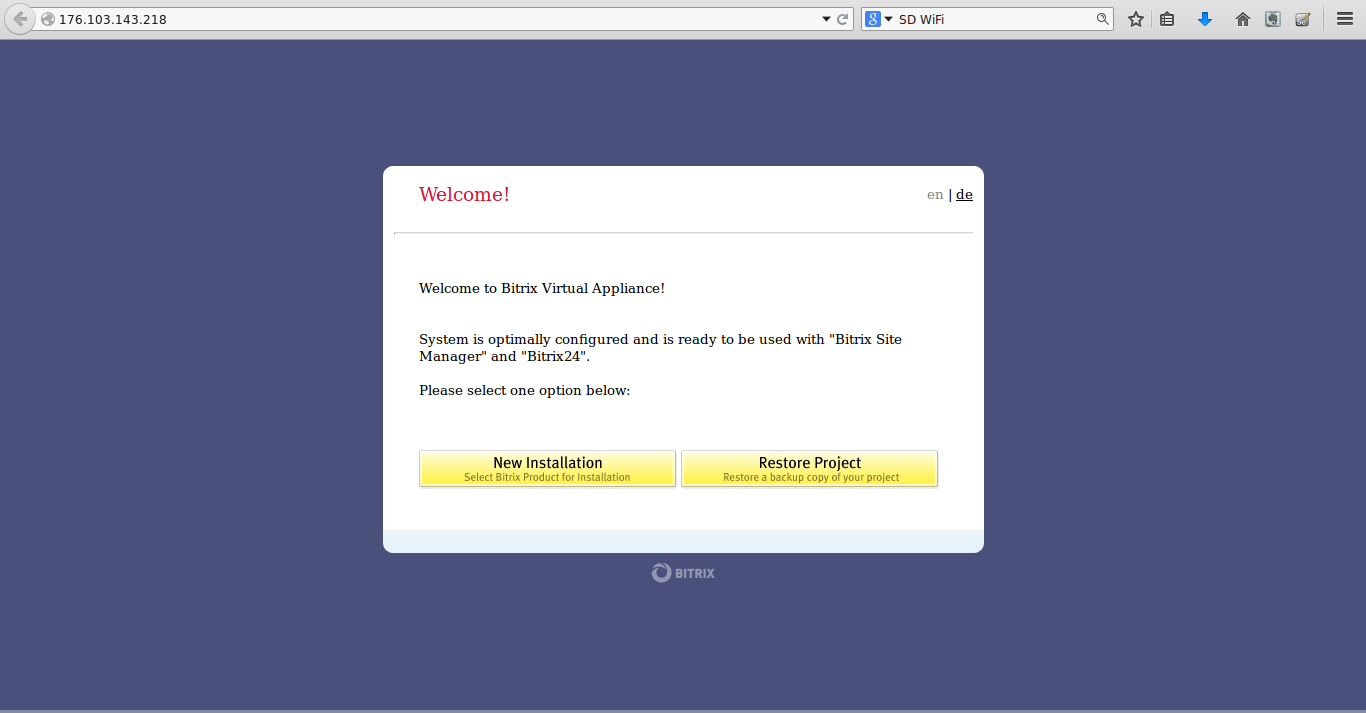
Ну а теперь перейдем к более приземленным вещам – запустим 1С-Битрикс на предустановленном образе с bitrixvm.
Заходим с браузера по ip и попадаем на страницу установщика CMS Битрикс:
Устанавливаем CMS и демо-данные…
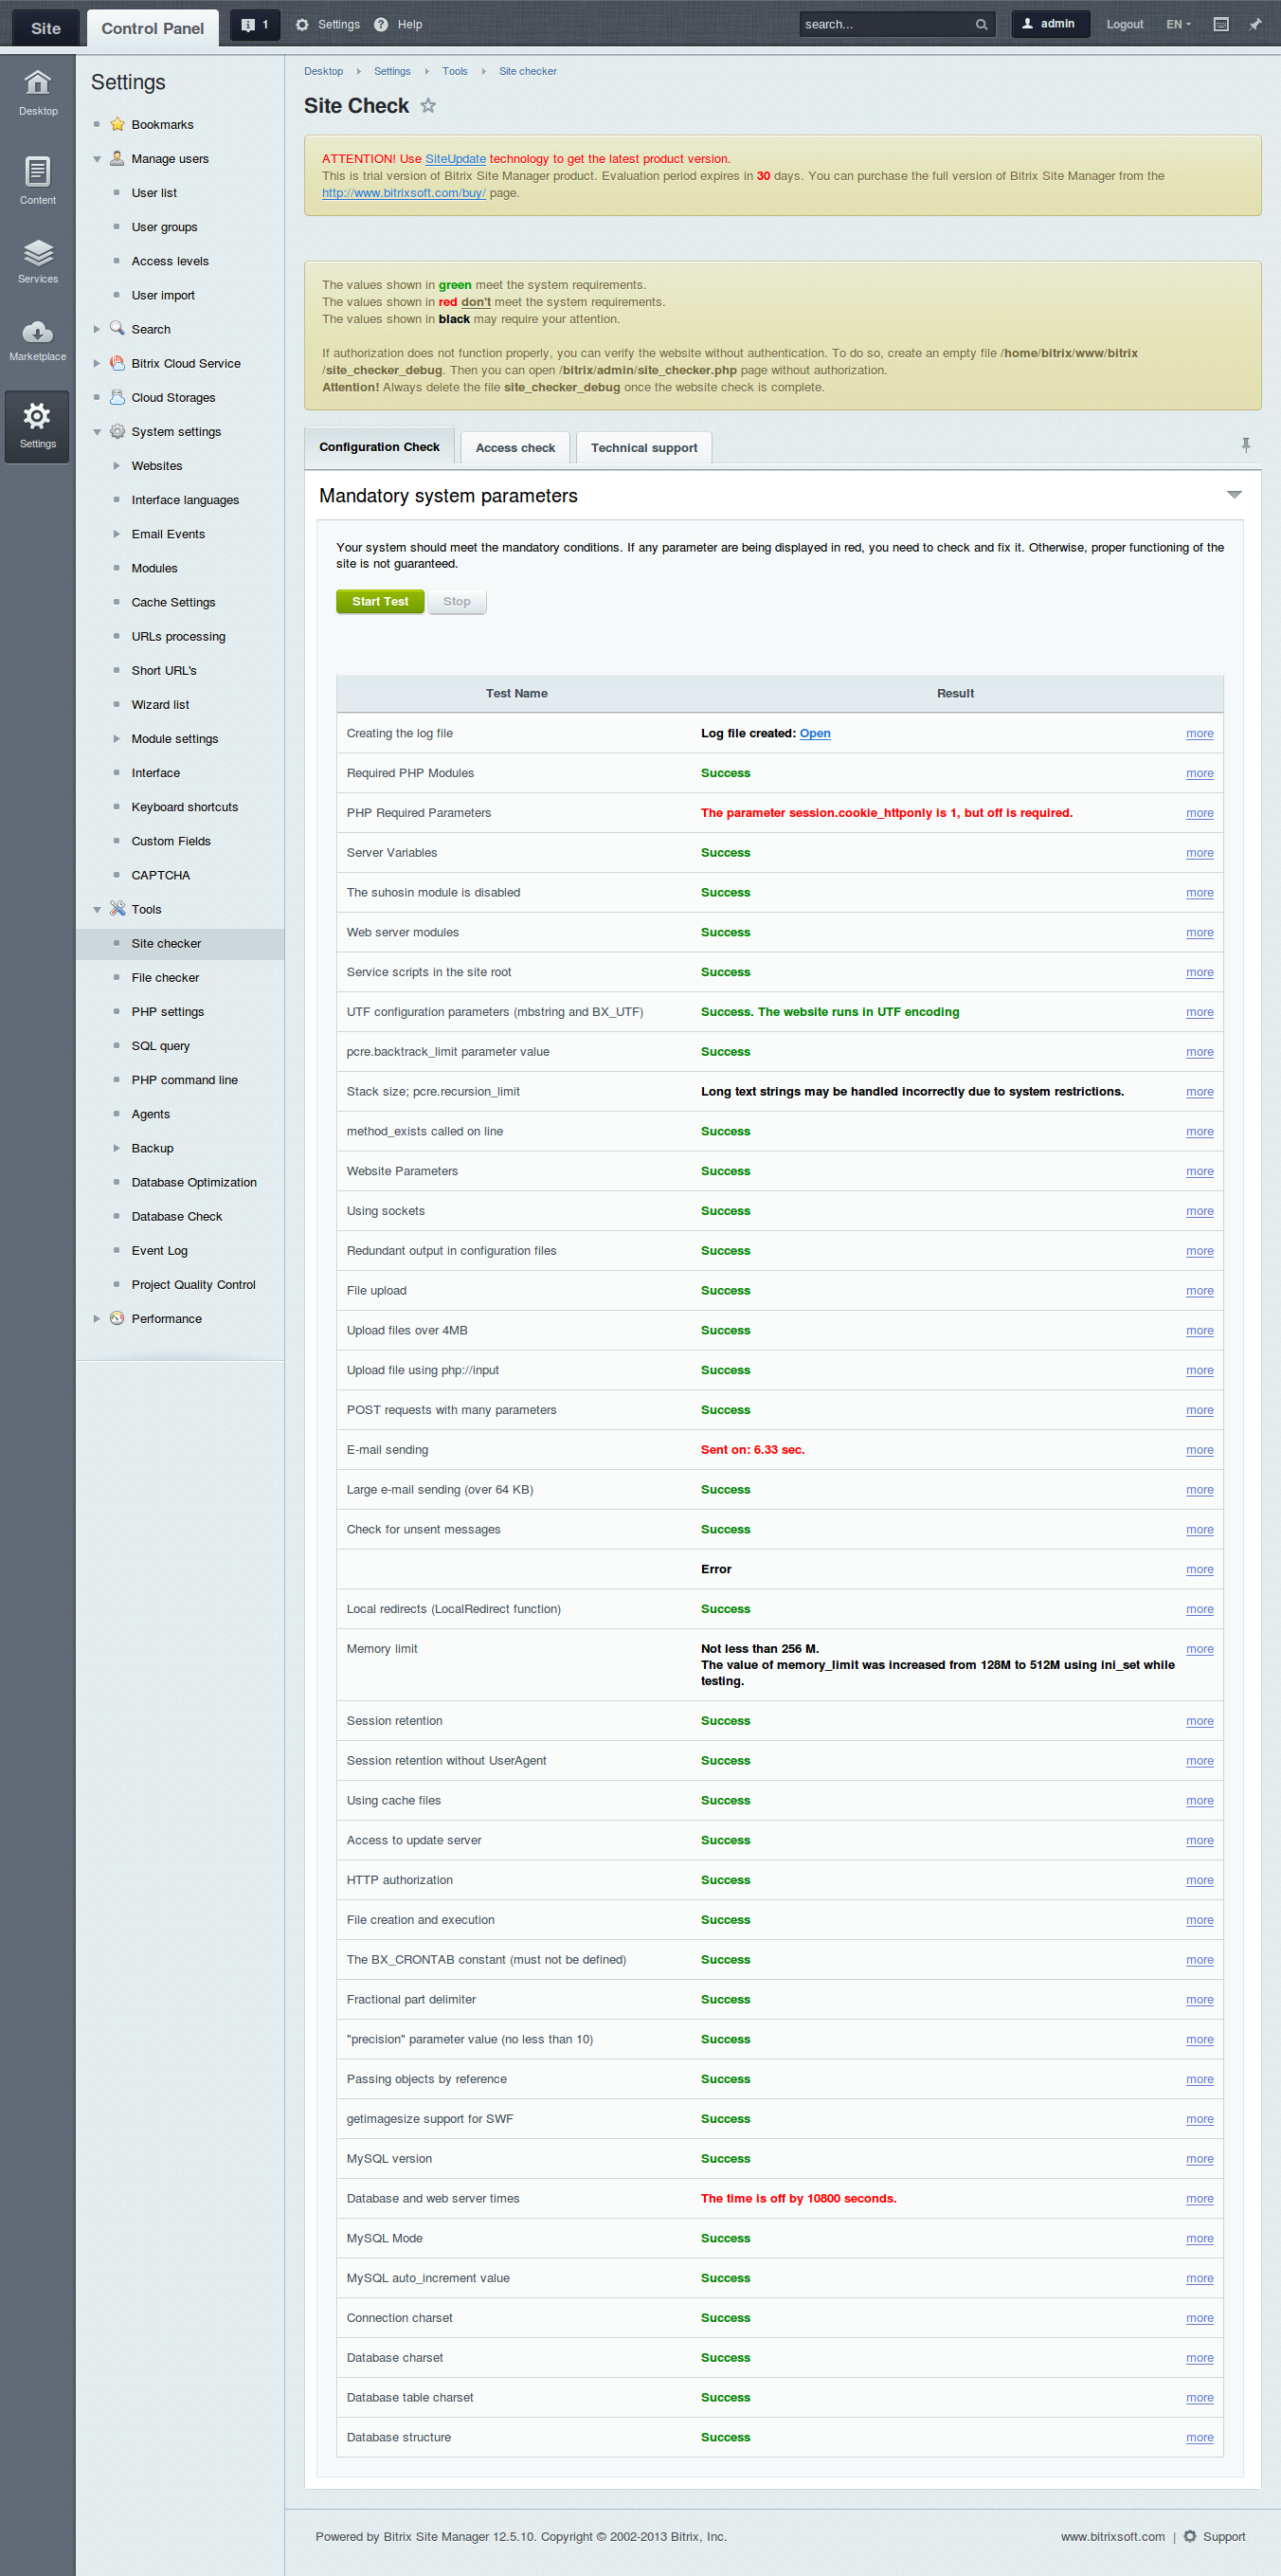
Запускаем встроенный инструмент проверки сайта:
Запускаем встроенный тест производительности Битрикс:
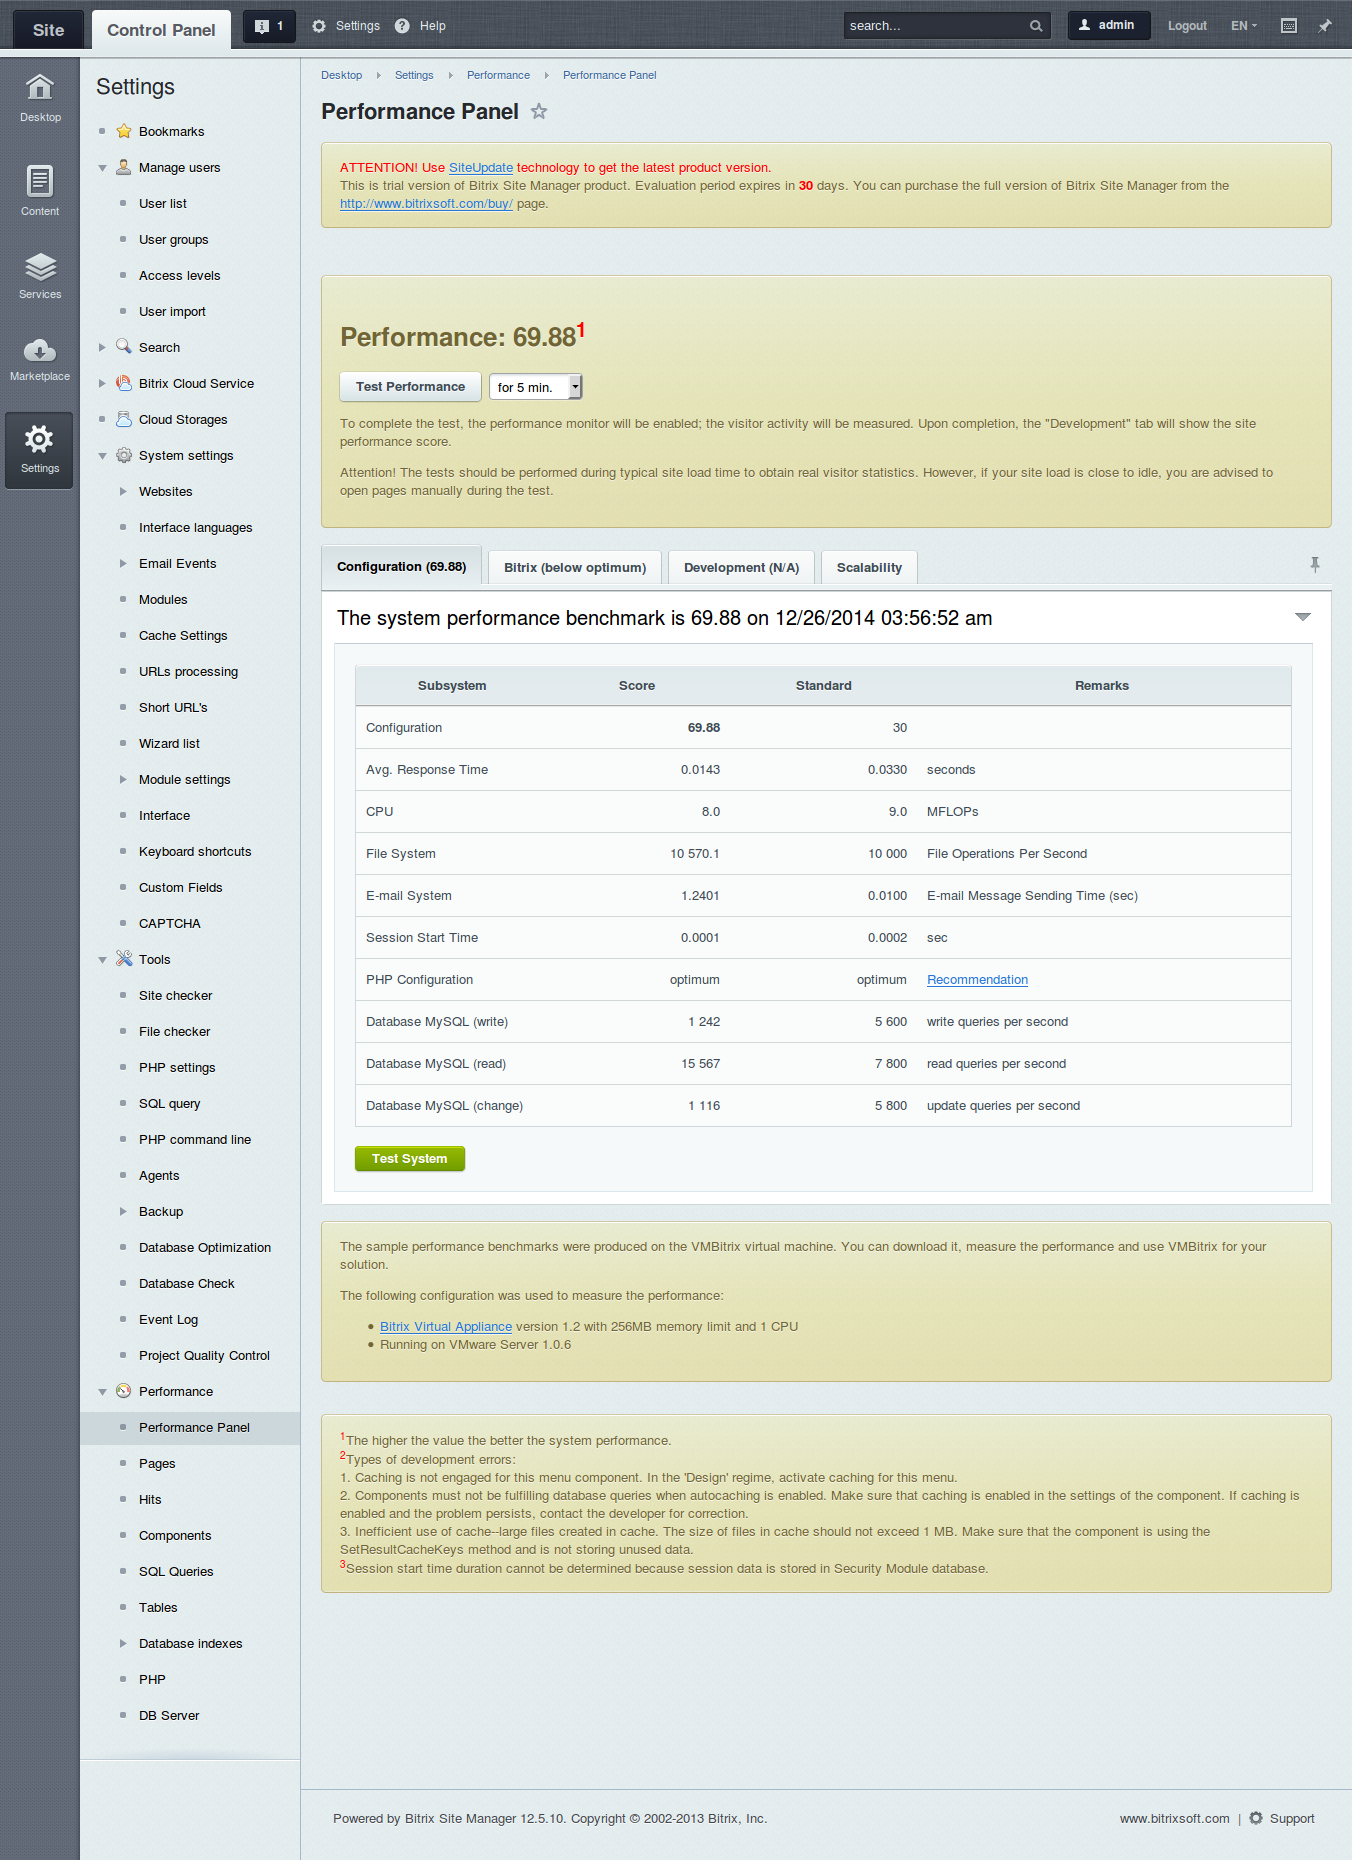
И в итоге наблюдаем 69 попугаев! =) Такие цифры не всегда можно наблюдать даже на выделенных серверах.
Тестим VNC
В качесте бонуса вот скрин с ubuntu-сервера с запущенным там браузером Firefox. Вполне себе быстро все бегает по VNC =)
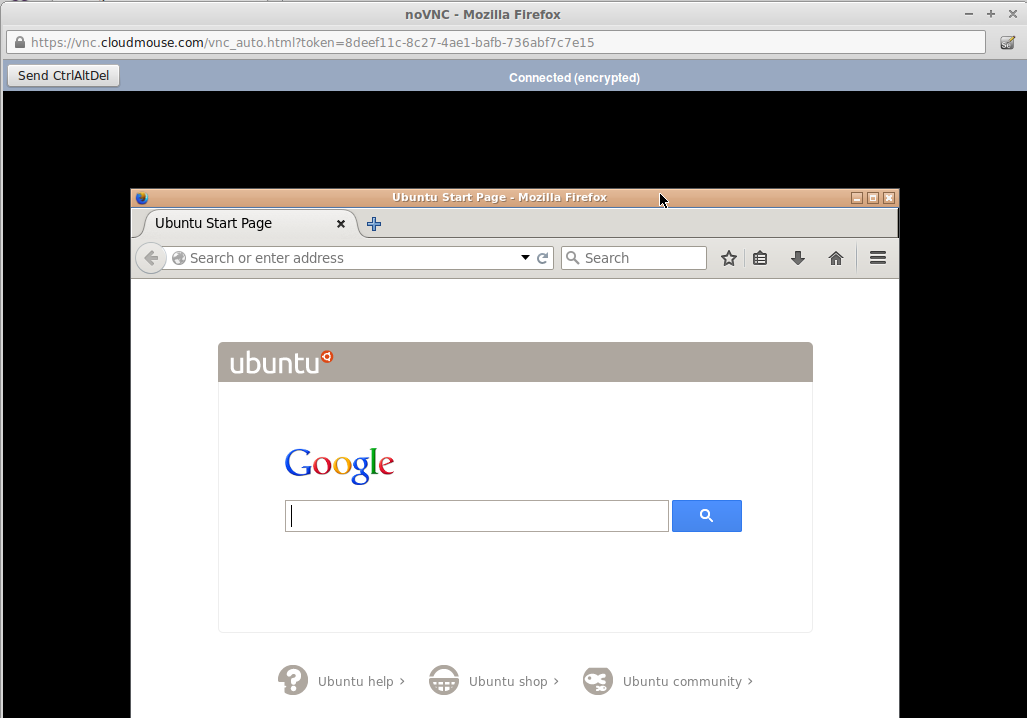
Справедливости ради скажу что варианта подключиться через отдельный VNC-клиент я не нашел, получилось подключиться только через клиент встроенный в панель управления cloudmouse.
Выводы
Рекомендую этот сервис для разработчиков которым приходится часто поднимать различные конфигурации на виртуальных машинах.
Управление инфраструктурой не в пример легче и проще крупных сервисов таких как Amazon AWS и MS Azure + русскоязычная отзывчивая поддержка.
В минус можно записать то что не нашел на сайте реквизитов юрлица и по всей видимости с сервисом нет возможности работать по безналу (тут точно не могу сказать).
К сожалению как оказалось не стоит доверять хостинг важных вещей таким вот небольшим провайдерам которые могут пропасть в любой момент. В первую очередь мне стоило обратить внимание на отсутствие возможности работы с юрлицами. Это уже причина задуматься.