![]()
Доброй ночи!
С этим сервисом я знаком давно. Появился он сразу следом за популярнейшим DigitalOcean и при схожем функционале начал давать более выгодные условия. К примеру появившийся на DO тариф за 5$ не менялся с 2012 года и сейчас стоит столько же. А vultr за те же деньги предлагает вдвое больше озу и в полтора раза больше диска (25 гигабайт). Есть также тариф за 2.5$, но в наличии я его ни в одной локации не нашел, везде sold out =)
Также Vultr интересен своими необычными локациями - кучка локаций в разных концах США включая локацию в кремниевой долине и экзотика типа Австралии, Сингапура и Японии.
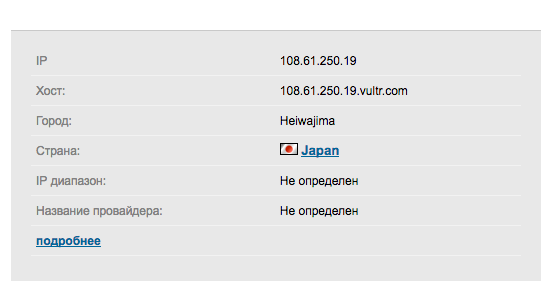
Вот собственно с японским сервером я и поигрался в районе часа. Отдал за это аж 0.01$. Этот сервис также выгодней юзать разработчикам используя API.
Первым делом решил глянуть пинг из Ульяновска до Токио.
:tmp rail$ ping 108.61.250.19
PING 108.61.250.19 (108.61.250.19): 56 data bytes
64 bytes from 108.61.250.19: icmp_seq=0 ttl=50 time=312.630 ms
64 bytes from 108.61.250.19: icmp_seq=1 ttl=50 time=311.154 ms
64 bytes from 108.61.250.19: icmp_seq=2 ttl=50 time=309.719 ms
64 bytes from 108.61.250.19: icmp_seq=3 ttl=50 time=311.281 ms
64 bytes from 108.61.250.19: icmp_seq=4 ttl=50 time=397.495 ms
64 bytes from 108.61.250.19: icmp_seq=5 ttl=50 time=310.744 ms
64 bytes from 108.61.250.19: icmp_seq=6 ttl=50 time=338.438 ms
64 bytes from 108.61.250.19: icmp_seq=7 ttl=50 time=310.338 ms
64 bytes from 108.61.250.19: icmp_seq=8 ttl=50 time=310.561 ms
64 bytes from 108.61.250.19: icmp_seq=9 ttl=50 time=310.182 ms
^C
--- 108.61.250.19 ping statistics ---
10 packets transmitted, 10 packets received, 0.0% packet loss
round-trip min/avg/max/stddev = 309.719/322.254/397.495/26.407 ms
Да это же вдвое больше чем до Канады!
Железо
Inxi
[root@vultr ~]# inxi -b
System:    Host: vultr.guest Kernel: 3.10.0-514.26.2.el7.x86_64 x86_64 bits: 64 Console: tty 0
           Distro: CentOS Linux release 7.4.1708 (Core)
Machine:   Device: kvm System: QEMU product: Standard PC (i440FX + PIIX 1996) v: pc-i440fx-2.10 serial: N/A
           Mobo: N/A model: N/A serial: N/A
           BIOS: SeaBIOS v: rel-1.10.2-0-g5f4c7b1-prebuilt.qemu-project.org date: 04/01/2014
CPU:       Single core Virtual a7769a6388d5 (-UP-) speed: 2394 MHz (max)
Graphics:  Card: Cirrus Logic GD 5446
           Display Server: N/A driver: cirrus tty size: 204x25 Advanced Data: N/A for root out of X
Network:   Card: Red Hat Virtio network device driver: virtio-pci
Drives:    HDD Total Size: 26.8GB (6.5% used)
Info:      Processes: 66 Uptime: 11 min Memory: 159.0/992.6MB Init: systemd runlevel: 3
           Client: Shell (bash) inxi: 2.3.43
CPU
[root@vultr ~]# cat /proc/cpuinfo
processor	: 0
vendor_id	: GenuineIntel
cpu family	: 6
model		: 61
model name	: Virtual CPU a7769a6388d5
stepping	: 2
microcode	: 0x1
cpu MHz		: 2394.454
cache size	: 16384 KB
physical id	: 0
siblings	: 1
core id		: 0
cpu cores	: 1
apicid		: 0
initial apicid	: 0
fpu		: yes
fpu_exception	: yes
cpuid level	: 13
wp		: yes
flags		: fpu vme de pse tsc msr pae mce cx8 apic sep mtrr pge mca cmov pat pse36 clflush mmx fxsr sse sse2 syscall nx rdtscp lm constant_tsc rep_good nopl xtopology eagerfpu pni pclmulqdq ssse3 fma cx16 pcid sse4_1 sse4_2 x2apic movbe popcnt tsc_deadline_timer aes xsave avx f16c rdrand hypervisor lahf_lm abm arat fsgsbase bmi1 avx2 smep bmi2 erms invpcid xsaveopt
bogomips	: 4788.90
clflush size	: 64
cache_alignment	: 64
address sizes	: 40 bits physical, 48 bits virtual
power management:
ОЗУ
[root@vultr ~]# cat /proc/meminfo
MemTotal:        1016380 kB
MemFree:          212180 kB
MemAvailable:     747720 kB
Buffers:           31056 kB
Cached:           613592 kB
SwapCached:            0 kB
Active:           342952 kB
Inactive:         364404 kB
Active(anon):      63224 kB
Inactive(anon):    12476 kB
Active(file):     279728 kB
Inactive(file):   351928 kB
Unevictable:           0 kB
Mlocked:               0 kB
SwapTotal:             0 kB
SwapFree:              0 kB
Dirty:                 0 kB
Writeback:             0 kB
AnonPages:         62740 kB
Mapped:            23824 kB
Shmem:             12992 kB
Slab:              76216 kB
SReclaimable:      63344 kB
SUnreclaim:        12872 kB
KernelStack:        1184 kB
PageTables:         2988 kB
NFS_Unstable:          0 kB
Bounce:                0 kB
WritebackTmp:          0 kB
CommitLimit:      508188 kB
Committed_AS:     202224 kB
VmallocTotal:   34359738367 kB
VmallocUsed:        8924 kB
VmallocChunk:   34359719676 kB
HardwareCorrupted:     0 kB
AnonHugePages:      4096 kB
HugePages_Total:       0
HugePages_Free:        0
HugePages_Rsvd:        0
HugePages_Surp:        0
Hugepagesize:       2048 kB
DirectMap4k:       53104 kB
DirectMap2M:      995328 kB
30GB SSD
[root@vultr ~]# df -HT
Filesystem     Type      Size  Used Avail Use% Mounted on
/dev/vda1      ext4       27G  1.8G   24G   7% /
devtmpfs       devtmpfs  511M     0  511M   0% /dev
tmpfs          tmpfs     521M     0  521M   0% /dev/shm
tmpfs          tmpfs     521M   14M  508M   3% /run
tmpfs          tmpfs     521M     0  521M   0% /sys/fs/cgroup
tmpfs          tmpfs     105M     0  105M   0% /run/user/0
PT Summary
[root@vultr ~]# pt-summary
# Percona Toolkit System Summary Report ######################
        Date | 2017-11-27 13:59:31 UTC (local TZ: UTC +0000)
    Hostname | vultr.guest
      Uptime | 18 min,  1 user,  load average: 0.07, 0.33, 0.33
      System | QEMU; Standard PC (i440FX + PIIX, 1996); vpc-i440fx-2.10 (Other)
 Service Tag | Not Specified
    Platform | Linux
     Release | CentOS Linux release 7.4.1708 (Core)
      Kernel | 3.10.0-514.26.2.el7.x86_64
Architecture | CPU = 64-bit, OS = 64-bit
   Threading | NPTL 2.17
    Compiler | GNU CC version 4.8.5 20150623 (Red Hat 4.8.5-16).
     SELinux | Disabled
 Virtualized | VMWare
# Processor ##################################################
  Processors | physical = 1, cores = 1, virtual = 1, hyperthreading = no
      Speeds | 1x2394.454
      Models | 1xVirtual CPU a7769a6388d5
      Caches | 1x16384 KB
# Memory #####################################################
       Total | 992.6M
        Free | 578.0M
        Used | physical = 82.7M, swap allocated = 0.0, swap used = 0.0, virtual = 82.7M
      Shared | 12.7M
     Buffers | 331.9M
      Caches | 738.6M
       Dirty | 28592 kB
     UsedRSS | 103.3M
  Swappiness | 30
 DirtyPolicy | 30, 10
 DirtyStatus | 0, 0
  Locator   Size     Speed             Form Factor   Type          Type Detail
  ========= ======== ================= ============= ============= ===========
  DIMM 0    1024 MB  Unknown           DIMM          RAM           Other
# Mounted Filesystems ########################################
  Filesystem  Size Used Type     Opts                                             Mountpoint
  devtmpfs    487M   0% devtmpfs rw,nosuid,size=498632k,nr_inodes=124658,mode=755 /dev
  /dev/vda1    25G   8% ext4     rw,relatime,data=ordered                         /
  tmpfs       100M   0% tmpfs    rw,nosuid,nodev                                  /run/user/0
  tmpfs       100M   0% tmpfs    rw,nosuid,nodev,mode=755                         /run/user/0
  tmpfs       100M   0% tmpfs    rw,nosuid,nodev,relatime,size=101640k,mode=700   /run/user/0
  tmpfs       100M   0% tmpfs    ro,nosuid,nodev,noexec,mode=755                  /run/user/0
  tmpfs       497M   0% tmpfs    rw,nosuid,nodev                                  /dev/shm
  tmpfs       497M   0% tmpfs    rw,nosuid,nodev,mode=755                         /dev/shm
  tmpfs       497M   0% tmpfs    rw,nosuid,nodev,relatime,size=101640k,mode=700   /dev/shm
  tmpfs       497M   0% tmpfs    ro,nosuid,nodev,noexec,mode=755                  /dev/shm
  tmpfs       497M   0% tmpfs    rw,nosuid,nodev                                  /sys/fs/cgroup
  tmpfs       497M   0% tmpfs    rw,nosuid,nodev,mode=755                         /sys/fs/cgroup
  tmpfs       497M   0% tmpfs    rw,nosuid,nodev,relatime,size=101640k,mode=700   /sys/fs/cgroup
  tmpfs       497M   0% tmpfs    ro,nosuid,nodev,noexec,mode=755                  /sys/fs/cgroup
  tmpfs       497M   3% tmpfs    rw,nosuid,nodev                                  /run
  tmpfs       497M   3% tmpfs    rw,nosuid,nodev,mode=755                         /run
  tmpfs       497M   3% tmpfs    rw,nosuid,nodev,relatime,size=101640k,mode=700   /run
  tmpfs       497M   3% tmpfs    ro,nosuid,nodev,noexec,mode=755                  /run
# Disk Schedulers And Queue Size #############################
         sr0 | [cfq] 128
         vda | 128
# Disk Partioning ############################################
Device       Type      Start        End               Size
============ ==== ========== ========== ==================
/dev/vda     Disk                              26843545600
/dev/vda1    Part       2048   52428749        26842470912
# Kernel Inode State #########################################
dentry-state | 87166	79288	45	0	0	0
     file-nr | 864	0	98554
    inode-nr | 18979	5953
# LVM Volumes ################################################
Unable to collect information
# LVM Volume Groups ##########################################
Unable to collect information
# RAID Controller ############################################
  Controller | No RAID controller detected
# Network Config #############################################
  Controller | Red Hat, Inc Virtio network device
 FIN Timeout | 60
  Port Range | 60999
# Interface Statistics #######################################
  interface  rx_bytes rx_packets  rx_errors   tx_bytes tx_packets  tx_errors
  ========= ========= ========== ========== ========== ========== ==========
  lo             5000         60          0       5000         60          0
  eth0      250000000      30000          0    4000000      22500          0
# Network Devices ############################################
  Device    Speed     Duplex
  ========= ========= =========
  eth0
# Top Processes ##############################################
  PID USER      PR  NI    VIRT    RES    SHR S %CPU %MEM     TIME+ COMMAND
 1710 root      20   0  157612   1988   1468 R  6.2  0.2   0:00.01 top
    1 root      20   0   43164   3472   2312 S  0.0  0.3   0:02.51 systemd
    2 root      20   0       0      0      0 S  0.0  0.0   0:00.00 kthreadd
    3 root      20   0       0      0      0 S  0.0  0.0   0:00.08 ksoftirqd/0
    5 root       0 -20       0      0      0 S  0.0  0.0   0:00.00 kworker/0:0H
    6 root      20   0       0      0      0 S  0.0  0.0   0:01.03 kworker/u2:0
    7 root      rt   0       0      0      0 S  0.0  0.0   0:00.00 migration/0
    8 root      20   0       0      0      0 S  0.0  0.0   0:00.00 rcu_bh
    9 root      20   0       0      0      0 R  0.0  0.0   0:00.45 rcu_sched
# Notable Processes ##########################################
  PID    OOM    COMMAND
 2956    -17    sshd
# Memory mamagement ##########################################
Transparent huge pages are enabled.
# The End ####################################################
Тесты
DD
[root@vultr ~]# dd if=/dev/zero of=test bs=64k count=16k conv=fdatasync
16384+0 records in
16384+0 records out
1073741824 bytes (1.1 GB) copied, 3.26523 s, 329 MB/s
[root@vultr ~]# rm -rf test
[root@vultr ~]# dd if=/dev/zero of=test bs=64k count=16k conv=fdatasync
16384+0 records in
16384+0 records out
1073741824 bytes (1.1 GB) copied, 3.12212 s, 344 MB/s
[root@vultr ~]# rm -rf test
[root@vultr ~]# dd if=/dev/zero of=test bs=64k count=16k conv=fdatasync
16384+0 records in
16384+0 records out
1073741824 bytes (1.1 GB) copied, 3.04638 s, 352 MB/s
[root@vultr ~]# rm -f test
Sysbench тест CPU
[root@vultr ~]# sysbench --test=cpu --cpu-max-prime=20000 --num-threads=1 run
WARNING: the --test option is deprecated. You can pass a script name or path on the command line without any options.
sysbench 1.0.9 (using system LuaJIT 2.0.4)

Running the test with following options:
Number of threads: 1
Initializing random number generator from current time


Prime numbers limit: 20000

Initializing worker threads...

Threads started!

CPU speed:
    events per second:   279.10

General statistics:
    total time:                          10.0035s
    total number of events:              2793

Latency (ms):
         min:                                  3.08
         avg:                                  3.58
         max:                                 10.51
         95th percentile:                      6.21
         sum:                               9992.51

Threads fairness:
    events (avg/stddev):           2793.0000/0.00
    execution time (avg/stddev):   9.9925/0.00
[root@vultr ~]# sysbench --test=mutex --num-threads=64 run
WARNING: the --test option is deprecated. You can pass a script name or path on the command line without any options.
WARNING: --num-threads is deprecated, use --threads instead
sysbench 1.0.9 (using system LuaJIT 2.0.4)

Running the test with following options:
Number of threads: 64
Initializing random number generator from current time


Initializing worker threads...

Threads started!


General statistics:
    total time:                          14.4160s
    total number of events:              64

Latency (ms):
         min:                              12966.25
         avg:                              13851.70
         max:                              14343.16
         95th percentile:                  14302.94
         sum:                             886508.66

Threads fairness:
    events (avg/stddev):           1.0000/0.00
    execution time (avg/stddev):   13.8517/0.28
Sysbench тест ОЗУ
[root@vultr ~]# sysbench --test=memory --num-threads=4 --memory-total-size=1G run
WARNING: the --test option is deprecated. You can pass a script name or path on the command line without any options.
WARNING: --num-threads is deprecated, use --threads instead
sysbench 1.0.9 (using system LuaJIT 2.0.4)

Running the test with following options:
Number of threads: 4
Initializing random number generator from current time


Running memory speed test with the following options:
  block size: 1KiB
  total size: 1024MiB
  operation: write
  scope: global

Initializing worker threads...

Threads started!

Total operations: 1048576 (1254265.04 per second)

1024.00 MiB transferred (1224.87 MiB/sec)


General statistics:
    total time:                          0.8332s
    total number of events:              1048576

Latency (ms):
         min:                                  0.00
         avg:                                  0.00
         max:                                 50.03
         95th percentile:                      0.00
         sum:                               1277.99

Threads fairness:
    events (avg/stddev):           262144.0000/0.00
    execution time (avg/stddev):   0.3195/0.04
Sysbench тест диска
[root@vultr ~]# sysbench --test=fileio --file-total-size=2G prepare
WARNING: the --test option is deprecated. You can pass a script name or path on the command line without any options.
sysbench 1.0.9 (using system LuaJIT 2.0.4)

128 files, 16384Kb each, 2048Mb total
Creating files for the test...
Extra file open flags: 0
Creating file test_file.0
...
Creating file test_file.127
2147483648 bytes written in 10.11 seconds (202.60 MiB/sec).

[root@vultr ~]# sysbench --test=fileio --file-total-size=2G --file-test-mode=rndrw --max-time=300 --max-requests=0 run
WARNING: the --test option is deprecated. You can pass a script name or path on the command line without any options.
WARNING: --max-time is deprecated, use --time instead
sysbench 1.0.9 (using system LuaJIT 2.0.4)

Running the test with following options:
Number of threads: 1
Initializing random number generator from current time


Extra file open flags: 0
128 files, 16MiB each
2GiB total file size
Block size 16KiB
Number of IO requests: 0
Read/Write ratio for combined random IO test: 1.50
Periodic FSYNC enabled, calling fsync() each 100 requests.
Calling fsync() at the end of test, Enabled.
Using synchronous I/O mode
Doing random r/w test
Initializing worker threads...

Threads started!


File operations:
    reads/s:                      1243.78
    writes/s:                     829.19
    fsyncs/s:                     2653.02

Throughput:
    read, MiB/s:                  19.43
    written, MiB/s:               12.96

General statistics:
    total time:                          300.0470s
    total number of events:              1418044

Latency (ms):
         min:                                  0.00
         avg:                                  0.21
         max:                                 32.52
         95th percentile:                      0.73
         sum:                             297261.73

Threads fairness:
    events (avg/stddev):           1418044.0000/0.00
    execution time (avg/stddev):   297.2617/0.00
SpeedTest
[root@vultr ~]# speedtest-cli
Retrieving speedtest.net configuration...
Testing from Choopa, LLC (108.61.250.19)...
Retrieving speedtest.net server list...
Selecting best server based on ping...
Hosted by IPA CyberLab (Bunkyo) [13.88 km]: 23.245 ms
Testing download speed................................................................................
Download: 539.09 Mbit/s
Testing upload speed....................................................................................................
Upload: 315.38 Mbit/s
7-zip benchmark
[root@vultr ~]# 7za b

7-Zip (a) [64] 16.02 : Copyright (c) 1999-2016 Igor Pavlov : 2016-05-21
p7zip Version 16.02 (locale=en_US.UTF-8,Utf16=on,HugeFiles=on,64 bits,1 CPU Virtual CPU a7769a6388d5 (306D2),ASM,AES-NI)

Virtual CPU a7769a6388d5 (306D2)
CPU Freq:  1147  1150  1154  1158  1160  1466  1811  2199  2348

RAM size:     992 MB,  # CPU hardware threads:   1
RAM usage:    435 MB,  # Benchmark threads:      1

                       Compressing  |                  Decompressing
Dict     Speed Usage    R/U Rating  |      Speed Usage    R/U Rating
         KiB/s     %   MIPS   MIPS  |      KiB/s     %   MIPS   MIPS

22:       2492    99   2438   2425  |      27881   100   2386   2381
23:       2476   100   2526   2523  |      24873   100   2161   2153
24:       2360   100   2548   2538  |      27370    99   2420   2403
25:       2024    99   2324   2312  |      23514   100   2097   2093
----------------------------------  | ------------------------------
Avr:             100   2459   2449  |              100   2266   2257
Tot:             100   2363   2353
Выводы
Япония… =)
UPD 2021:
Это промокод который дает 100$ на ваш аккаунт на 14 дней. Думаю этого хватит чтобы протестировать услуги хостинга 😋
