![]()
Доброй ночи!
Очень давно сюда не писал, а ведь получил промокод на тестирование новых виртуалок с NVME-дисками еще на конференции “Стачка” в апреле 2018 года. Тогда же я все и затестил, а потом просто забыл все опубликовать =) Теперь вот исправляю оплошность.
Панель управления
Тут все просто, нас встречает VMmanager в котором можно создавать инстансы и выбирать ОС из шаблонов или предустановленные окружения (Битрикс, Django и т.д.).
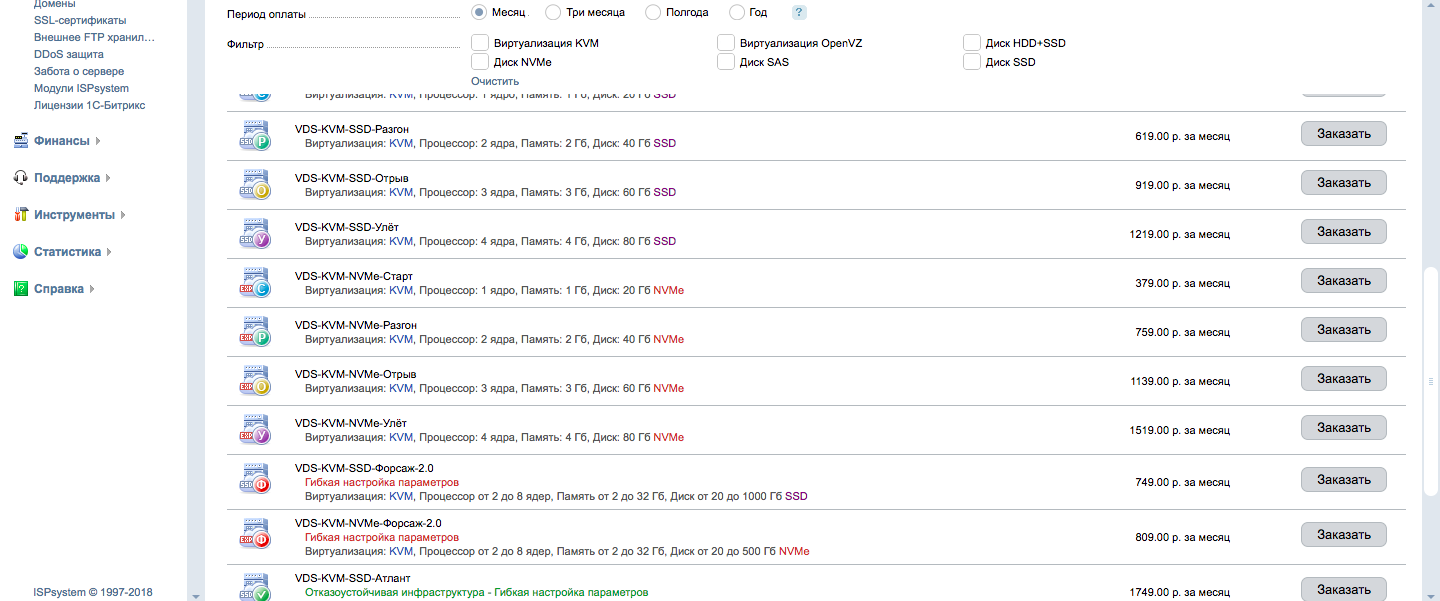
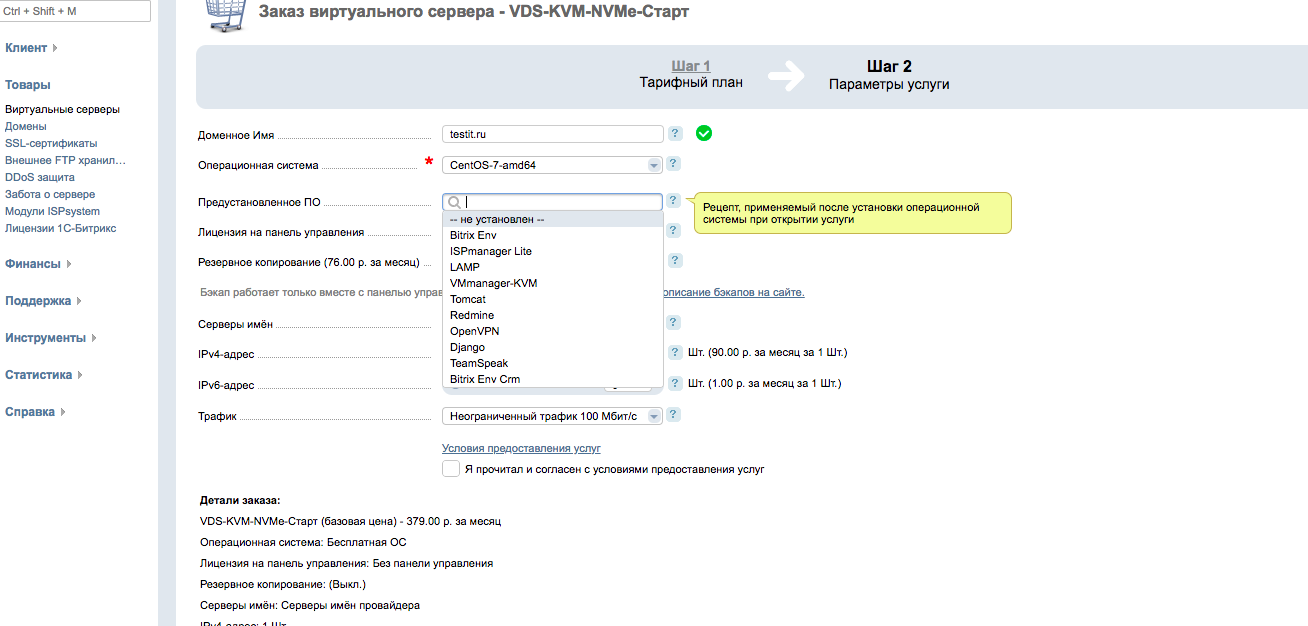
Выбранная мной машина стоит 379 рублей в месяц. За эту сумму нам дают 1 ядро, 1 гигабайт ОЗУ и 20 гигабайт NVME-диска на KVM. На нее я традиционно поставил CentOS.
Сведения о VM
CentOS 7.4
[root@testit ~]# uname -a
Linux testit.ru 3.10.0-693.21.1.el7.x86_64 #1 SMP Wed Mar 7 19:03:37 UTC 2018 x86_64 x86_64 x86_64 GNU/Linux
[root@testit ~]# cat /etc/centos-release
CentOS Linux release 7.4.1708 (Core)
Виртуализация KVM
[root@testit ~]# inxi -b
System:    Host: testit.ru Kernel: 3.10.0-693.21.1.el7.x86_64 x86_64 bits: 64 Console: tty 0
           Distro: CentOS Linux release 7.4.1708 (Core)
Machine:   Device: kvm System: Red Hat product: KVM v: RHEL 7.4.0 PC (i440FX + PIIX 1996) serial: N/A
           Mobo: N/A model: N/A serial: N/A BIOS: SeaBIOS v: 1.10.2-3.el7_4.1 date: 04/01/2014
CPU:       Single core QEMU Virtual version 2.5+ (-UP-) speed: 2394 MHz (max)
Graphics:  Card: Cirrus Logic GD 5446
           Display Server: N/A driver: cirrus tty size: 204x25 Advanced Data: N/A for root out of X
Network:   Card: Red Hat Virtio network device driver: virtio-pci
Drives:    HDD Total Size: 21.5GB (6.0% used)
Info:      Processes: 74 Uptime: 5 min Memory: 133.3/992.3MB Init: systemd runlevel: 3
           Client: Shell (bash) inxi: 2.3.56
CPU и ОЗУ
[root@testit ~]# cat /proc/cpuinfo
processor : 0
vendor_id : GenuineIntel
cpu family  : 6
model   : 13
model name  : QEMU Virtual CPU version 2.5+
stepping  : 3
microcode : 0x1
cpu MHz   : 2394.374
cache size  : 16384 KB
physical id : 0
siblings  : 1
core id   : 0
cpu cores : 1
apicid    : 0
initial apicid  : 0
fpu   : yes
fpu_exception : yes
cpuid level : 13
wp    : yes
flags   : fpu de pse tsc msr pae mce cx8 apic sep mtrr pge mca cmov pse36 clflush mmx fxsr sse sse2 syscall nx lm rep_good nopl xtopology pni cx16 x2apic hypervisor lahf_lm
bogomips  : 4788.74
clflush size  : 64
cache_alignment : 64
address sizes : 46 bits physical, 48 bits virtual
power management:

[root@testit ~]# cat /proc/meminfo
MemTotal:        1016076 kB
MemFree:          596992 kB
MemAvailable:     762532 kB
Buffers:            2088 kB
Cached:           283712 kB
SwapCached:            0 kB
Active:           247940 kB
Inactive:          99836 kB
Active(anon):      62188 kB
Inactive(anon):     6432 kB
Active(file):     185752 kB
Inactive(file):    93404 kB
Unevictable:           0 kB
Mlocked:               0 kB
SwapTotal:             0 kB
SwapFree:              0 kB
Dirty:             13384 kB
Writeback:             0 kB
AnonPages:         62008 kB
Mapped:            19732 kB
Shmem:              6644 kB
Slab:              38904 kB
SReclaimable:      28336 kB
SUnreclaim:        10568 kB
KernelStack:        1360 kB
PageTables:         3332 kB
NFS_Unstable:          0 kB
Bounce:                0 kB
WritebackTmp:          0 kB
CommitLimit:      508036 kB
Committed_AS:     237228 kB
VmallocTotal:   34359738367 kB
VmallocUsed:        9948 kB
VmallocChunk:   34359719676 kB
HardwareCorrupted:     0 kB
AnonHugePages:     10240 kB
HugePages_Total:       0
HugePages_Free:        0
HugePages_Rsvd:        0
HugePages_Surp:        0
Hugepagesize:       2048 kB
DirectMap4k:       44912 kB
DirectMap2M:     1003520 kB
Разметка диска
[root@testit ~]# df -HT
Файловая система Тип      Размер Использовано  Дост Использовано% Cмонтировано в
/dev/vda2        xfs         22G         1,2G   21G            6% /
devtmpfs         devtmpfs   510M            0  510M            0% /dev
tmpfs            tmpfs      521M            0  521M            0% /dev/shm
tmpfs            tmpfs      521M         6,9M  514M            2% /run
tmpfs            tmpfs      521M            0  521M            0% /sys/fs/cgroup
/dev/vda1        ext4       252M         111M  124M           48% /boot
tmpfs            tmpfs      105M            0  105M            0% /run/user/0
PT Summary
[root@testit ~]# pt-summary
# Percona Toolkit System Summary Report ######################
        Date | 2018-04-10 21:22:10 UTC (local TZ: MSK +0300)
    Hostname | testit.ru
      Uptime | 7 min,  1 user,  load average: 0,43, 0,12, 0,04
      System | Red Hat; KVM; vRHEL 7.4.0 PC (i440FX + PIIX, 1996) (Other)
 Service Tag | Not Specified
    Platform | Linux
     Release | CentOS Linux release 7.4.1708 (Core)
      Kernel | 3.10.0-693.21.1.el7.x86_64
Architecture | CPU = 64-bit, OS = 64-bit
   Threading | NPTL 2.17
     SELinux | Disabled
 Virtualized | VMWare
# Processor ##################################################
  Processors | physical = 1, cores = 1, virtual = 1, hyperthreading = no
      Speeds | 1x2394.374
      Models | 1xQEMU Virtual CPU version 2.5+
      Caches | 1x16384 KB
# Memory #####################################################
       Total | 992,3M
        Free | 536,2M
        Used | physical = 95,3M, swap allocated = 0,0, swap used = 0,0, virtual = 95,3M
      Shared | 6,5M
     Buffers | 360,8M
      Caches | 737,6M
       Dirty | 33908 kB
     UsedRSS | 121,6M
  Swappiness | 30
 DirtyPolicy | 30, 10
 DirtyStatus | 0, 0
  Locator   Size     Speed             Form Factor   Type          Type Detail
  ========= ======== ================= ============= ============= ===========
  DIMM 0    1024 MB  Unknown           DIMM          RAM           Other
# Mounted Filesystems ########################################
  Filesystem  Size Used Type     Opts                                             Mountpoint
  devtmpfs    486M   0% devtmpfs rw,nosuid,size=497236k,nr_inodes=124309,mode=755 /dev
  /dev/vda1   240M  48% ext4     rw,relatime,data=ordered                         /boot
  /dev/vda2    20G   6% xfs      rw,relatime,attr2,inode64,noquota                /
  tmpfs       100M   0% tmpfs    rw,nosuid,nodev                                  /run/user/0
  tmpfs       100M   0% tmpfs    rw,nosuid,nodev,mode=755                         /run/user/0
  tmpfs       100M   0% tmpfs    rw,nosuid,nodev,relatime,size=101608k,mode=700   /run/user/0
  tmpfs       100M   0% tmpfs    ro,nosuid,nodev,noexec,mode=755                  /run/user/0
  tmpfs       497M   0% tmpfs    rw,nosuid,nodev                                  /dev/shm
  tmpfs       497M   0% tmpfs    rw,nosuid,nodev,mode=755                         /dev/shm
  tmpfs       497M   0% tmpfs    rw,nosuid,nodev,relatime,size=101608k,mode=700   /dev/shm
  tmpfs       497M   0% tmpfs    ro,nosuid,nodev,noexec,mode=755                  /dev/shm
  tmpfs       497M   0% tmpfs    rw,nosuid,nodev                                  /sys/fs/cgroup
  tmpfs       497M   0% tmpfs    rw,nosuid,nodev,mode=755                         /sys/fs/cgroup
  tmpfs       497M   0% tmpfs    rw,nosuid,nodev,relatime,size=101608k,mode=700   /sys/fs/cgroup
  tmpfs       497M   0% tmpfs    ro,nosuid,nodev,noexec,mode=755                  /sys/fs/cgroup
  tmpfs       497M   2% tmpfs    rw,nosuid,nodev                                  /run
  tmpfs       497M   2% tmpfs    rw,nosuid,nodev,mode=755                         /run
  tmpfs       497M   2% tmpfs    rw,nosuid,nodev,relatime,size=101608k,mode=700   /run
  tmpfs       497M   2% tmpfs    ro,nosuid,nodev,noexec,mode=755                  /run
# Disk Schedulers And Queue Size #############################
         vda | 128
# Disk Partioning ############################################
Device       Type      Start        End               Size
============ ==== ========== ========== ==================
/dev/vda     Disk                              21474836480
/dev/vda1    Part       2048     526335          268434944
/dev/vda2    Part     526336   41943039        21205351936
# Kernel Inode State #########################################
dentry-state | 80120  69918 45  0 0 0
     file-nr | 992  0 98137
    inode-nr | 17831  293
# LVM Volumes ################################################
Unable to collect information
# LVM Volume Groups ##########################################
Unable to collect information
# RAID Controller ############################################
  Controller | No RAID controller detected
# Network Config #############################################
  Controller | Red Hat, Inc Virtio network device
 FIN Timeout | 60
  Port Range | 60999
# Interface Statistics #######################################
  interface  rx_bytes rx_packets  rx_errors   tx_bytes tx_packets  tx_errors
  ========= ========= ========== ========== ========== ========== ==========
  lo                0          0          0          0          0          0
  eth0       35000000      15000          0    1000000      12500          0
# Network Devices ############################################
  Device    Speed     Duplex
  ========= ========= =========
  eth0
# Top Processes ##############################################
  PID USER      PR  NI    VIRT    RES    SHR S %CPU %MEM     TIME+ COMMAND
    1 root      20   0  125200   3596   2424 S  0,0  0,4   0:00.75 systemd
    2 root      20   0       0      0      0 S  0,0  0,0   0:00.00 kthreadd
    3 root      20   0       0      0      0 S  0,0  0,0   0:00.01 ksoftirqd/0
    5 root       0 -20       0      0      0 S  0,0  0,0   0:00.00 kworker/0:0H
    6 root      20   0       0      0      0 S  0,0  0,0   0:00.00 kworker/u2:0
    7 root      rt   0       0      0      0 S  0,0  0,0   0:00.00 migration/0
    8 root      20   0       0      0      0 S  0,0  0,0   0:00.00 rcu_bh
    9 root      20   0       0      0      0 S  0,0  0,0   0:00.07 rcu_sched
   10 root      rt   0       0      0      0 S  0,0  0,0   0:00.00 watchdog/0
# Notable Processes ##########################################
  PID    OOM    COMMAND
  818    -17    sshd
# Memory mamagement ##########################################
Transparent huge pages are enabled.
# The End ####################################################
Локаль и время тут уже настроены для российских пользователей.
[root@testit ~]# locale
LANG=ru_RU.UTF-8
LC_CTYPE="ru_RU.UTF-8"
LC_NUMERIC="ru_RU.UTF-8"
LC_TIME="ru_RU.UTF-8"
LC_COLLATE="ru_RU.UTF-8"
LC_MONETARY="ru_RU.UTF-8"
LC_MESSAGES="ru_RU.UTF-8"
LC_PAPER="ru_RU.UTF-8"
LC_NAME="ru_RU.UTF-8"
LC_ADDRESS="ru_RU.UTF-8"
LC_TELEPHONE="ru_RU.UTF-8"
LC_MEASUREMENT="ru_RU.UTF-8"
LC_IDENTIFICATION="ru_RU.UTF-8"
LC_ALL=ru_RU.UTF-8

[root@testit ~]# date
Ср апр 11 00:22:35 MSK 2018
Тесты
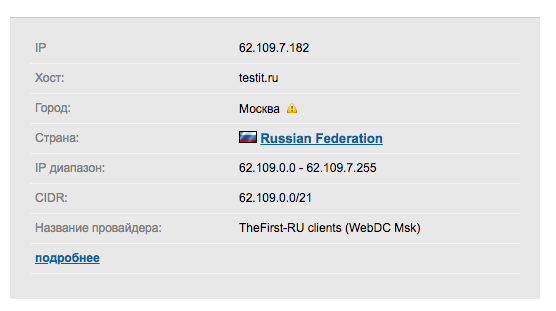
Пинг из Ульяновска
rail$ ping 62.109.7.182
PING 62.109.7.182 (62.109.7.182): 56 data bytes
64 bytes from 62.109.7.182: icmp_seq=0 ttl=53 time=21.618 ms
64 bytes from 62.109.7.182: icmp_seq=1 ttl=53 time=21.818 ms
64 bytes from 62.109.7.182: icmp_seq=2 ttl=53 time=23.299 ms
64 bytes from 62.109.7.182: icmp_seq=3 ttl=53 time=22.876 ms
64 bytes from 62.109.7.182: icmp_seq=4 ttl=53 time=21.654 ms
64 bytes from 62.109.7.182: icmp_seq=5 ttl=53 time=21.047 ms
64 bytes from 62.109.7.182: icmp_seq=6 ttl=53 time=21.677 ms
64 bytes from 62.109.7.182: icmp_seq=7 ttl=53 time=20.948 ms
64 bytes from 62.109.7.182: icmp_seq=8 ttl=53 time=20.960 ms
64 bytes from 62.109.7.182: icmp_seq=9 ttl=53 time=21.799 ms
64 bytes from 62.109.7.182: icmp_seq=10 ttl=53 time=20.976 ms
^C
--- 62.109.7.182 ping statistics ---
11 packets transmitted, 11 packets received, 0.0% packet loss
round-trip min/avg/max/stddev = 20.948/21.697/23.299/0.741 ms
DD
[root@testit ~]# dd if=/dev/zero of=test bs=64k count=16k conv=fdatasync
16384+0 записей получено
16384+0 записей отправлено
 скопировано 1073741824 байта (1,1 GB), 3,07767 c, 349 MB/c
[root@testit ~]# rm -f test
[root@testit ~]# dd if=/dev/zero of=test bs=64k count=16k conv=fdatasync
16384+0 записей получено
16384+0 записей отправлено
 скопировано 1073741824 байта (1,1 GB), 1,66757 c, 644 MB/c
[root@testit ~]# rm -f test
[root@testit ~]# dd if=/dev/zero of=test bs=64k count=16k conv=fdatasync
16384+0 записей получено
16384+0 записей отправлено
 скопировано 1073741824 байта (1,1 GB), 1,76471 c, 608 MB/c
[root@testit ~]# rm -f test
Sysbench тест CPU
[root@testit ~]# sysbench --test=cpu --cpu-max-prime=20000 --num-threads=1 run
WARNING: the --test option is deprecated. You can pass a script name or path on the command line without any options.
sysbench 1.0.14 (using bundled LuaJIT 2.1.0-beta2)

Running the test with following options:
Number of threads: 1
Initializing random number generator from current time


Prime numbers limit: 20000

Initializing worker threads...

Threads started!

CPU speed:
    events per second:   362.59

General statistics:
    total time:                          10.0008s
    total number of events:              3627

Latency (ms):
         min:                                    2.61
         avg:                                    2.76
         max:                                    5.65
         95th percentile:                        2.86
         sum:                                 9997.20

Threads fairness:
    events (avg/stddev):           3627.0000/0.00
    execution time (avg/stddev):   9.9972/0.00
[root@testit ~]# sysbench --test=mutex --num-threads=64 run
WARNING: the --test option is deprecated. You can pass a script name or path on the command line without any options.
WARNING: --num-threads is deprecated, use --threads instead
sysbench 1.0.14 (using bundled LuaJIT 2.1.0-beta2)

Running the test with following options:
Number of threads: 64
Initializing random number generator from current time


Initializing worker threads...

Threads started!


General statistics:
    total time:                          12.0053s
    total number of events:              64

Latency (ms):
         min:                                10655.84
         avg:                                11445.40
         max:                                11969.88
         95th percentile:                    11946.04
         sum:                               732505.41

Threads fairness:
    events (avg/stddev):           1.0000/0.00
    execution time (avg/stddev):   11.4454/0.32
Sysbench тест ОЗУ
[root@testit ~]# sysbench --test=memory --num-threads=4 --memory-total-size=1G run
WARNING: the --test option is deprecated. You can pass a script name or path on the command line without any options.
WARNING: --num-threads is deprecated, use --threads instead
sysbench 1.0.14 (using bundled LuaJIT 2.1.0-beta2)

Running the test with following options:
Number of threads: 4
Initializing random number generator from current time


Running memory speed test with the following options:
  block size: 1KiB
  total size: 1024MiB
  operation: write
  scope: global

Initializing worker threads...

Threads started!

Total operations: 1048576 (3115822.43 per second)

1024.00 MiB transferred (3042.80 MiB/sec)


General statistics:
    total time:                          0.3344s
    total number of events:              1048576

Latency (ms):
         min:                                    0.00
         avg:                                    0.00
         max:                                   44.01
         95th percentile:                        0.00
         sum:                                  328.22

Threads fairness:
    events (avg/stddev):           262144.0000/0.00
    execution time (avg/stddev):   0.0821/0.05
Sysbench тест диска
[root@testit ~]# sysbench --test=fileio --file-total-size=2G prepare
WARNING: the --test option is deprecated. You can pass a script name or path on the command line without any options.
sysbench 1.0.14 (using bundled LuaJIT 2.1.0-beta2)

128 files, 16384Kb each, 2048Mb total
Creating files for the test...
Extra file open flags: (none)
Creating file test_file.0
...
Creating file test_file.127
2147483648 bytes written in 7.58 seconds (270.13 MiB/sec).

[root@testit ~]# sysbench --test=fileio --file-total-size=2G --file-test-mode=rndrw --max-time=300 --max-requests=0 run
WARNING: the --test option is deprecated. You can pass a script name or path on the command line without any options.
WARNING: --max-time is deprecated, use --time instead
sysbench 1.0.14 (using bundled LuaJIT 2.1.0-beta2)

Running the test with following options:
Number of threads: 1
Initializing random number generator from current time


Extra file open flags: (none)
128 files, 16MiB each
2GiB total file size
Block size 16KiB
Number of IO requests: 0
Read/Write ratio for combined random IO test: 1.50
Periodic FSYNC enabled, calling fsync() each 100 requests.
Calling fsync() at the end of test, Enabled.
Using synchronous I/O mode
Doing random r/w test
Initializing worker threads...

Threads started!


File operations:
    reads/s:                      3876.37
    writes/s:                     2584.25
    fsyncs/s:                     8269.34

Throughput:
    read, MiB/s:                  60.57
    written, MiB/s:               40.38

General statistics:
    total time:                          300.0153s
    total number of events:              4419249

Latency (ms):
         min:                                    0.00
         avg:                                    0.07
         max:                                  292.42
         95th percentile:                        0.19
         sum:                               296209.83

Threads fairness:
    events (avg/stddev):           4419249.0000/0.00
    execution time (avg/stddev):   296.2098/0.00
SpeedTest
[root@testit ~]# speedtest-cli
Retrieving speedtest.net configuration...
Testing from JSC ISPsystem (62.109.7.182)...
Retrieving speedtest.net server list...
Selecting best server based on ping...
Hosted by Megafon (Moscow) [1.61 km]: 4.968 ms
Testing download speed................................................................................
Download: 93.68 Mbit/s
Testing upload speed....................................................................................................
Upload: 137.67 Mbit/s
7-zip benchmark
[root@testit ~]# 7za b

7-Zip (a) [64] 16.02 : Copyright (c) 1999-2016 Igor Pavlov : 2016-05-21
p7zip Version 16.02 (locale=ru_RU.UTF-8,Utf16=on,HugeFiles=on,64 bits,1 CPU QEMU Virtual CPU version 2.5+ (6D3),ASM)

QEMU Virtual CPU version 2.5+ (6D3)
CPU Freq:  2459  2779  2785  2778  2768  2489  2761  2758  2752

RAM size:     992 MB,  # CPU hardware threads:   1
RAM usage:    435 MB,  # Benchmark threads:      1

                       Compressing  |                  Decompressing
Dict     Speed Usage    R/U Rating  |      Speed Usage    R/U Rating
         KiB/s     %   MIPS   MIPS  |      KiB/s     %   MIPS   MIPS

22:       2887   100   2820   2809  |      31903   100   2718   2724
23:       2948   100   3015   3005  |      30910   100   2680   2676
24:       2628   100   2830   2827  |      30390   100   2667   2668
25:       2422   100   2771   2765  |      29553   100   2633   2630
----------------------------------  | ------------------------------
Avr:             100   2859   2851  |              100   2674   2674
Tot:             100   2767   2763
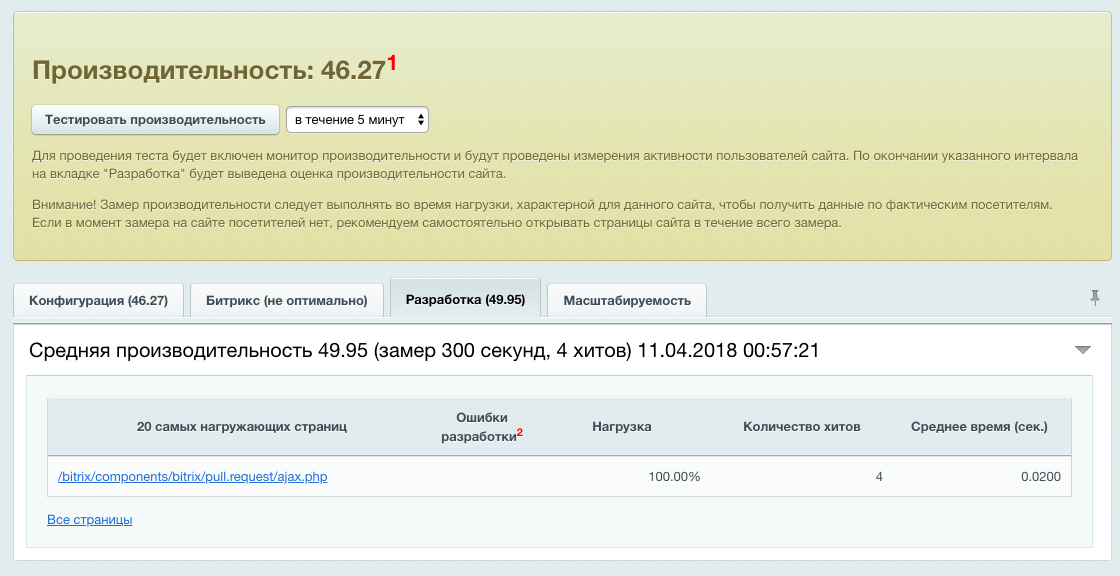
Битрикс-попугаи
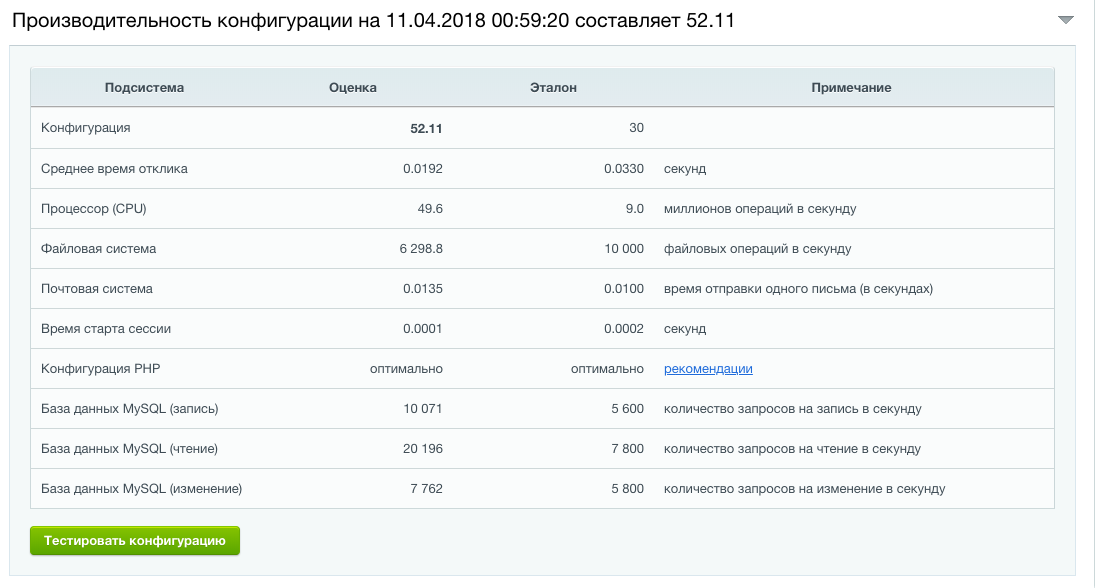
Выводы
Хороший сервис за свои деньги. Виртуалки довольно быстро работают и ими приятно пользоваться.