
Добрый день!
Решил тут затестить самый дешевый тариф VPS от Ihor за 100 рублей в месяц. За эти деньги нам доступна виртуальная машина с 512 мегабайтами оперативной памяти, 1 ядром и 10 гигабайтами HDD.
Процесс заказа
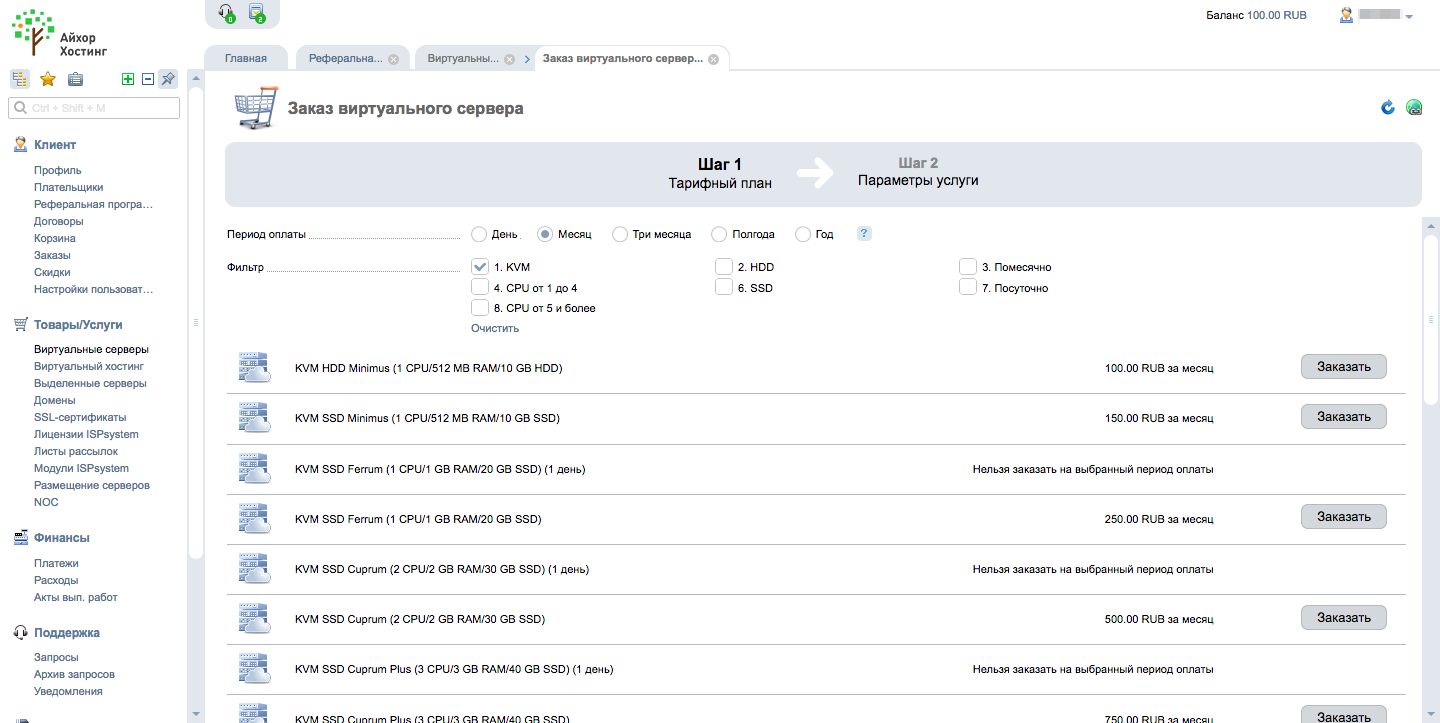
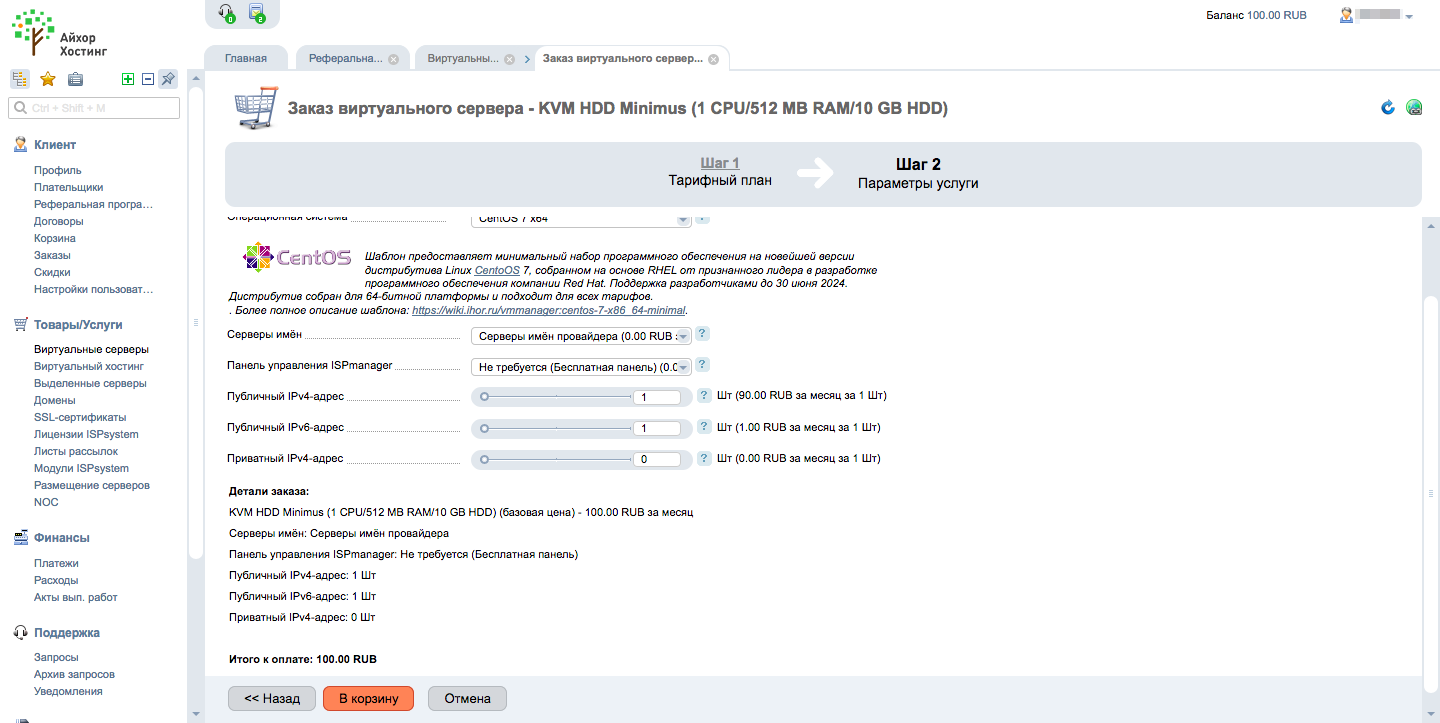
Есть большой выбор ОС.
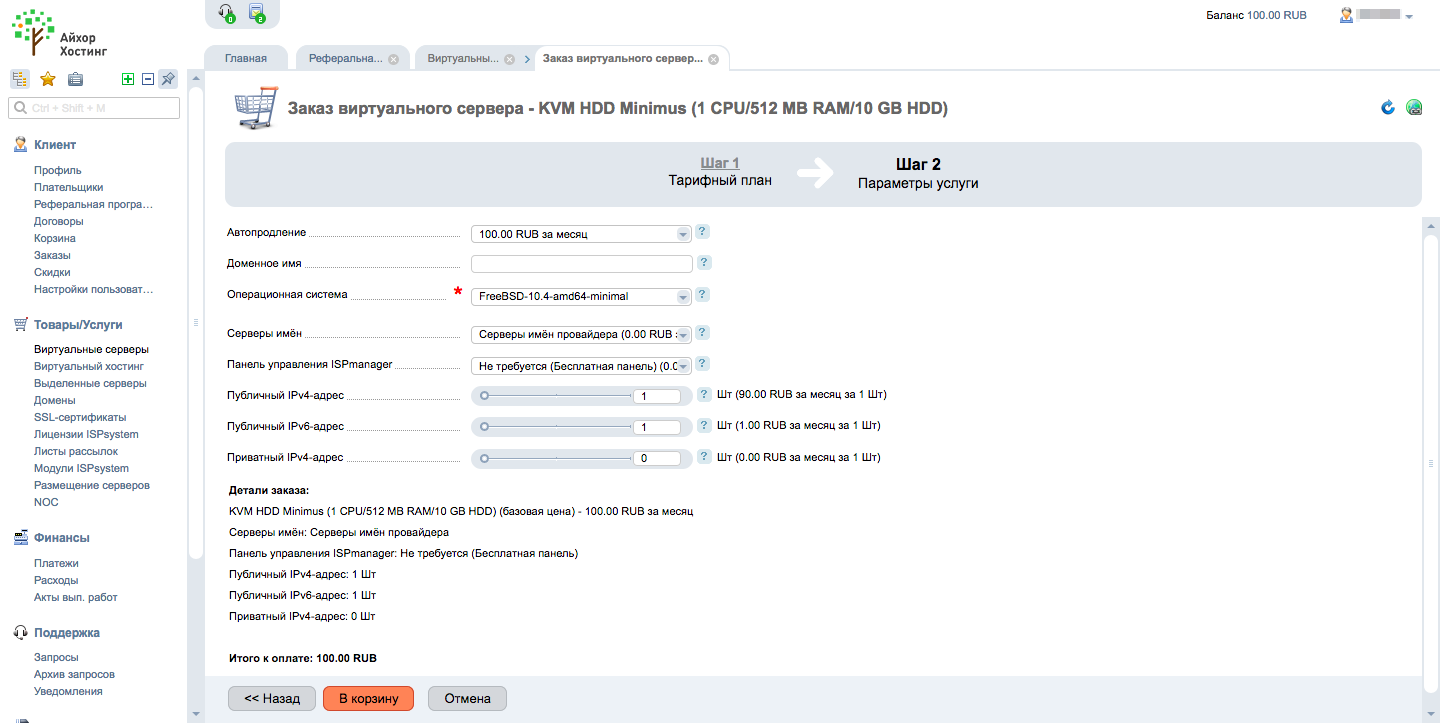
Можно докупить панель управления и ip-адреса
Сведения о VM
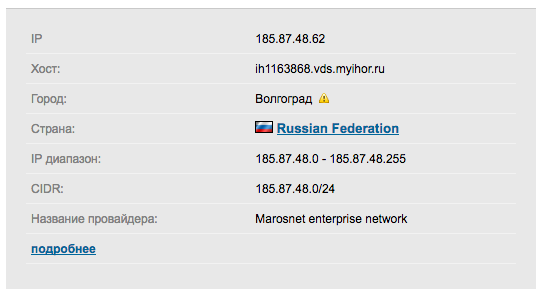
IP
CentOS 7.5
cat /etc/centos-release
-----------
CentOS Linux release 7.5.1804 (Core)
uname -a
-----------
Linux ih1163868.vds.myihor.ru 3.10.0-862.3.3.el7.x86_64 #1 SMP Fri Jun 15 04:15:27 UTC 2018 x86_64 x86_64 x86_64 GNU/Linux
Виртуализация KVM
inxi -b
-----------
System:    Host: ih1163868.vds.myihor.ru Kernel: 3.10.0-862.3.3.el7.x86_64 x86_64 bits: 64 Console: N/A
           Distro: CentOS Linux release 7.5.1804 (Core)
Machine:   Type: Kvm System: Red Hat product: KVM v: RHEL 7.3.0 PC (i440FX + PIIX, 1996) serial: N/A
           Mobo: N/A model: N/A serial: N/A BIOS: SeaBIOS v: 1.10.2-3.el7_4.1 date: 04/01/2014
CPU:       Single Core: Intel Xeon E5620 type: MCP speed: 2400 MHz
Graphics:  Card-1: Cirrus Logic GD 5446 driver: cirrus v: kernel
           Display: server: No display server data found. Headless machine? tty: 204x24
           Message: Unable to show advanced data. Required tool glxinfo missing.
Network:   Card-1: Intel 82371AB/EB/MB PIIX4 ACPI type: network bridge driver: piix4_smbus
           Card-2: Red Hat Virtio network driver: virtio-pci
Drives:    Local Storage: total: 10.00 GiB used: 1.33 GiB (13.3%)
Info:      Processes: 67 Uptime: 1h 12m Memory: 487.6 MiB used: 87.5 MiB (17.9%) Init: systemd runlevel: 3
           Shell: clstr_test.sh inxi: 3.0.20
CPU и ОЗУ
cat /proc/cpuinfo
-----------
processor : 0
vendor_id : GenuineIntel
cpu family  : 6
model   : 44
model name  : Intel(R) Xeon(R) CPU           E5620  @ 2.40GHz
stepping  : 2
microcode : 0x1
cpu MHz   : 2400.084
cache size  : 4096 KB
physical id : 0
siblings  : 1
core id   : 0
cpu cores : 1
apicid    : 0
initial apicid  : 0
fpu   : yes
fpu_exception : yes
cpuid level : 11
wp    : yes
flags   : fpu vme de pse tsc msr pae mce cx8 apic sep mtrr pge mca cmov pat pse36 clflush mmx fxsr sse sse2 ss syscall nx pdpe1gb rdtscp lm constant_tsc arch_perfmon rep_good nopl eagerfpu pni pclmulqdq ssse3 cx16 pcid sse4_1 sse4_2 x2apic popcnt tsc_deadline_timer aes hypervisor lahf_lm tsc_adjust arat
bogomips  : 4800.16
clflush size  : 64
cache_alignment : 64
address sizes : 40 bits physical, 48 bits virtual
power management:


Memory Info:
====================================================
cat /proc/meminfo
-----------
MemTotal:         499340 kB
MemFree:          381820 kB
MemAvailable:     421380 kB
Buffers:            1476 kB
Cached:            41516 kB
SwapCached:            0 kB
Active:            50976 kB
Inactive:          22716 kB
Active(anon):      31096 kB
Inactive(anon):     4172 kB
Active(file):      19880 kB
Inactive(file):    18544 kB
Unevictable:           0 kB
Mlocked:               0 kB
SwapTotal:             0 kB
SwapFree:              0 kB
Dirty:                44 kB
Writeback:             0 kB
AnonPages:         30776 kB
Mapped:             7076 kB
Shmem:              4536 kB
Slab:              23908 kB
SReclaimable:      14264 kB
SUnreclaim:         9644 kB
KernelStack:        1328 kB
PageTables:         3560 kB
NFS_Unstable:          0 kB
Bounce:                0 kB
WritebackTmp:          0 kB
CommitLimit:      249668 kB
Committed_AS:     196092 kB
VmallocTotal:   34359738367 kB
VmallocUsed:        7940 kB
VmallocChunk:   34359723772 kB
HardwareCorrupted:     0 kB
AnonHugePages:         0 kB
CmaTotal:              0 kB
CmaFree:               0 kB
HugePages_Total:       0
HugePages_Free:        0
HugePages_Rsvd:        0
HugePages_Surp:        0
Hugepagesize:       2048 kB
DirectMap4k:       49008 kB
DirectMap2M:      475136 kB
DirectMap1G:           0 kB
Разметка диска
df -HT
-----------
Файловая система Тип      Размер Использовано  Дост Использовано% Cмонтировано в
/dev/vda1        ext4        11G         1,5G  8,7G           15% /
devtmpfs         devtmpfs   245M            0  245M            0% /dev
tmpfs            tmpfs      256M            0  256M            0% /dev/shm
tmpfs            tmpfs      256M         4,7M  252M            2% /run
tmpfs            tmpfs      256M            0  256M            0% /sys/fs/cgroup
tmpfs            tmpfs       52M            0   52M            0% /run/user/0
PT Summary
pt-summary
-----------
# Percona Toolkit System Summary Report ######################
        Date | 2018-08-21 00:36:40 UTC (local TZ: MSK +0300)
    Hostname | ih1163868.vds.myihor.ru
      Uptime |  1:12,  1 user,  load average: 0,51, 2,58, 2,41
      System | Red Hat; KVM; vRHEL 7.3.0 PC (i440FX + PIIX, 1996) (Other)
 Service Tag | Not Specified
    Platform | Linux
     Release | CentOS Linux release 7.5.1804 (Core)
      Kernel | 3.10.0-862.3.3.el7.x86_64
Architecture | CPU = 64-bit, OS = 64-bit
   Threading | NPTL 2.17
     SELinux | Disabled
 Virtualized | VMWare
# Processor ##################################################
  Processors | physical = 1, cores = 1, virtual = 1, hyperthreading = no
      Speeds | 1x2400.084
      Models | 1xIntel(R) Xeon(R) CPU E5620 @ 2.40GHz
      Caches | 1x4096 KB
# Memory #####################################################
       Total | 487,6M
        Free | 371,1M
        Used | physical = 50,5M, swap allocated = 0,0, swap used = 0,0, virtual = 50,5M
      Shared | 4,4M
     Buffers | 66,1M
      Caches | 410,5M
       Dirty | 124 kB
     UsedRSS | 48,9M
  Swappiness | 30
 DirtyPolicy | 30, 10
 DirtyStatus | 0, 0
  Locator   Size     Speed             Form Factor   Type          Type Detail
  ========= ======== ================= ============= ============= ===========
  DIMM 0    512 MB   Unknown           DIMM          RAM           Other
# Mounted Filesystems ########################################
  Filesystem  Size Used Type     Opts                                            Mountpoint
  devtmpfs    234M   0% devtmpfs rw,nosuid,size=239032k,nr_inodes=59758,mode=755 /dev
  /dev/vda1   9,9G  15% ext4     rw,relatime,data=ordered                        /
  tmpfs       244M   0% tmpfs    rw,nosuid,nodev                                 /dev/shm
  tmpfs       244M   0% tmpfs    rw,nosuid,nodev,mode=755                        /dev/shm
  tmpfs       244M   0% tmpfs    rw,nosuid,nodev,relatime,size=49936k,mode=700   /dev/shm
  tmpfs       244M   0% tmpfs    ro,nosuid,nodev,noexec,mode=755                 /dev/shm
  tmpfs       244M   0% tmpfs    rw,nosuid,nodev                                 /sys/fs/cgroup
  tmpfs       244M   0% tmpfs    rw,nosuid,nodev,mode=755                        /sys/fs/cgroup
  tmpfs       244M   0% tmpfs    rw,nosuid,nodev,relatime,size=49936k,mode=700   /sys/fs/cgroup
  tmpfs       244M   0% tmpfs    ro,nosuid,nodev,noexec,mode=755                 /sys/fs/cgroup
  tmpfs       244M   2% tmpfs    rw,nosuid,nodev                                 /run
  tmpfs       244M   2% tmpfs    rw,nosuid,nodev,mode=755                        /run
  tmpfs       244M   2% tmpfs    rw,nosuid,nodev,relatime,size=49936k,mode=700   /run
  tmpfs       244M   2% tmpfs    ro,nosuid,nodev,noexec,mode=755                 /run
  tmpfs        49M   0% tmpfs    rw,nosuid,nodev                                 /run/user/0
  tmpfs        49M   0% tmpfs    rw,nosuid,nodev,mode=755                        /run/user/0
  tmpfs        49M   0% tmpfs    rw,nosuid,nodev,relatime,size=49936k,mode=700   /run/user/0
  tmpfs        49M   0% tmpfs    ro,nosuid,nodev,noexec,mode=755                 /run/user/0
# Disk Schedulers And Queue Size #############################
         vda | [mq-deadline] 256
# Disk Partioning ############################################
Device       Type      Start        End               Size
============ ==== ========== ========== ==================
/dev/vda     Disk                              10737418240
/dev/vda1    Part       2048   20971519        10736369152
# Kernel Inode State #########################################
dentry-state | 10036  2180  45  0 0 0
     file-nr | 960  0 46911
    inode-nr | 9811 534
# LVM Volumes ################################################
Unable to collect information
# LVM Volume Groups ##########################################
Unable to collect information
# RAID Controller ############################################
  Controller | No RAID controller detected
# Network Config #############################################
  Controller | Red Hat, Inc. Virtio network device
 FIN Timeout | 60
  Port Range | 60999
# Interface Statistics #######################################
  interface  rx_bytes rx_packets  rx_errors   tx_bytes tx_packets  tx_errors
  ========= ========= ========== ========== ========== ========== ==========
  lo                0          0          0          0          0          0
  eth0      300000000     125000          0   45000000     100000          0
# Network Devices ############################################
  Device    Speed     Duplex
  ========= ========= =========
  eth0
# Top Processes ##############################################
  PID USER      PR  NI    VIRT    RES    SHR S %CPU %MEM     TIME+ COMMAND
    1 root      20   0   51504   1684    528 S  0,0  0,3   0:01.59 systemd
    2 root      20   0       0      0      0 S  0,0  0,0   0:00.00 kthreadd
    3 root      20   0       0      0      0 S  0,0  0,0   0:00.06 ksoftirqd/0
    5 root       0 -20       0      0      0 S  0,0  0,0   0:00.00 kworker/0:0H
    6 root      20   0       0      0      0 S  0,0  0,0   0:00.23 kworker/u2:0
    7 root      rt   0       0      0      0 S  0,0  0,0   0:00.00 migration/0
    8 root      20   0       0      0      0 S  0,0  0,0   0:00.00 rcu_bh
    9 root      20   0       0      0      0 S  0,0  0,0   0:00.42 rcu_sched
   10 root       0 -20       0      0      0 S  0,0  0,0   0:00.00 lru-add-dra+
# Notable Processes ##########################################
  PID    OOM    COMMAND
  687    -17    sshd
# Memory mamagement ##########################################
Transparent huge pages are currently disabled on the system.
# The End ####################################################
Тесты
DD
dd if=/dev/zero of=test bs=64k count=16k conv=fdatasync 2>&1
rm -f test
-----------
16384+0 записей получено
16384+0 записей отправлено
 скопировано 1073741824 байта (1,1 GB), 22,1292 c, 48,5 MB/c
16384+0 записей получено
16384+0 записей отправлено
 скопировано 1073741824 байта (1,1 GB), 13,9233 c, 77,1 MB/c
16384+0 записей получено
16384+0 записей отправлено
 скопировано 1073741824 байта (1,1 GB), 14,1105 c, 76,1 MB/c
Sysbench тест CPU
sysbench cpu --cpu-max-prime=20000 --num-threads=1 run
-----------
sysbench 1.0.15 (using bundled LuaJIT 2.1.0-beta2)

Running the test with following options:
Number of threads: 1
Initializing random number generator from current time


Prime numbers limit: 20000

Initializing worker threads...

Threads started!

CPU speed:
    events per second:   265.35

General statistics:
    total time:                          10.0031s
    total number of events:              2655

Latency (ms):
         min:                                    3.70
         avg:                                    3.77
         max:                                    5.42
         95th percentile:                        3.82
         sum:                                 9998.41

Threads fairness:
    events (avg/stddev):           2655.0000/0.00
    execution time (avg/stddev):   9.9984/0.00
sysbench mutex --threads=64 run
-----------
sysbench 1.0.15 (using bundled LuaJIT 2.1.0-beta2)

Running the test with following options:
Number of threads: 64
Initializing random number generator from current time


Initializing worker threads...

Threads started!


General statistics:
    total time:                          27.7733s
    total number of events:              64

Latency (ms):
         min:                                26885.56
         avg:                                27283.97
         max:                                27747.13
         95th percentile:                    27846.48
         sum:                              1746173.85

Threads fairness:
    events (avg/stddev):           1.0000/0.00
    execution time (avg/stddev):   27.2840/0.22
Sysbench тест ОЗУ
sysbench memory --num-threads=4 --memory-total-size=512M run
-----------
WARNING: --num-threads is deprecated, use --threads instead
sysbench 1.0.15 (using bundled LuaJIT 2.1.0-beta2)

Running the test with following options:
Number of threads: 4
Initializing random number generator from current time


Running memory speed test with the following options:
  block size: 1KiB
  total size: 512MiB
  operation: write
  scope: global

Initializing worker threads...

Threads started!

Total operations: 524288 (3055665.77 per second)

512.00 MiB transferred (2984.05 MiB/sec)


General statistics:
    total time:                          0.1691s
    total number of events:              524288

Latency (ms):
         min:                                    0.00
         avg:                                    0.00
         max:                                   44.01
         95th percentile:                        0.00
         sum:                                  219.19

Threads fairness:
    events (avg/stddev):           131072.0000/0.00
    execution time (avg/stddev):   0.0548/0.03
Sysbench тест диска
sysbench fileio --file-total-size=1G prepare
-----------
sysbench 1.0.15 (using bundled LuaJIT 2.1.0-beta2)

128 files, 8192Kb each, 1024Mb total
Creating files for the test...
Extra file open flags: (none)
Creating file test_file.0
...
Creating file test_file.127
1073741824 bytes written in 44.89 seconds (22.81 MiB/sec).

sysbench fileio --file-total-size=1G --file-test-mode=rndrw --time=300 --max-requests=0 run
-----------
sysbench 1.0.15 (using bundled LuaJIT 2.1.0-beta2)

Running the test with following options:
Number of threads: 1
Initializing random number generator from current time


Extra file open flags: (none)
128 files, 8MiB each
1GiB total file size
Block size 16KiB
Number of IO requests: 0
Read/Write ratio for combined random IO test: 1.50
Periodic FSYNC enabled, calling fsync() each 100 requests.
Calling fsync() at the end of test, Enabled.
Using synchronous I/O mode
Doing random r/w test
Initializing worker threads...

Threads started!


File operations:
    reads/s:                      25.95
    writes/s:                     17.30
    fsyncs/s:                     55.48

Throughput:
    read, MiB/s:                  0.41
    written, MiB/s:               0.27

General statistics:
    total time:                          316.7773s
    total number of events:              31146

Latency (ms):
         min:                                    0.00
         avg:                                    9.64
         max:                                 5849.32
         95th percentile:                       41.10
         sum:                               300151.31

Threads fairness:
    events (avg/stddev):           31146.0000/0.00
    execution time (avg/stddev):   300.1513/0.00
SpeedTest
speedtest-cli
-----------
Retrieving speedtest.net configuration...
Testing from MAROSNET Telecommunication Company LLC (185.87.48.62)...
Retrieving speedtest.net server list...
Selecting best server based on ping...
Hosted by Megafon (Moscow) [0.15 km]: 2.927 ms
Testing download speed................................................................................
Download: 101.87 Mbit/s
Testing upload speed....................................................................................................
Upload: 162.79 Mbit/s
Пинг из Ульяновска
rail$ ping 185.87.48.62
PING 185.87.48.62 (185.87.48.62): 56 data bytes
64 bytes from 185.87.48.62: icmp_seq=0 ttl=57 time=21.008 ms
64 bytes from 185.87.48.62: icmp_seq=1 ttl=57 time=22.276 ms
64 bytes from 185.87.48.62: icmp_seq=2 ttl=57 time=22.148 ms
64 bytes from 185.87.48.62: icmp_seq=3 ttl=57 time=48.899 ms
64 bytes from 185.87.48.62: icmp_seq=4 ttl=57 time=22.003 ms
64 bytes from 185.87.48.62: icmp_seq=5 ttl=57 time=20.463 ms
64 bytes from 185.87.48.62: icmp_seq=6 ttl=57 time=21.174 ms
64 bytes from 185.87.48.62: icmp_seq=7 ttl=57 time=20.528 ms
64 bytes from 185.87.48.62: icmp_seq=8 ttl=57 time=22.039 ms
64 bytes from 185.87.48.62: icmp_seq=9 ttl=57 time=21.672 ms
^C
--- 185.87.48.62 ping statistics ---
10 packets transmitted, 10 packets received, 0.0% packet loss
round-trip min/avg/max/stddev = 20.463/24.221/48.899/8.250 ms
7-zip benchmark
7za b
-----------

Бенчмарк внезапно крашнулся
Выводы
Сервер радует низкой ценой, но вот с HDD живется не очень хорошо. Я бы посоветовал взять более дорогой тариф за 150 рублей c SSD. Думаю подойдет для каких-либо нетребовательных по ресурсам систем которые по какой-то причине нет возможности запустить на шаред-хостинге. Также радует что виртуалка расположена в Москве (ДЦ Мароснет) и находится под защитой от DDoS.