![]()
Добрый день!
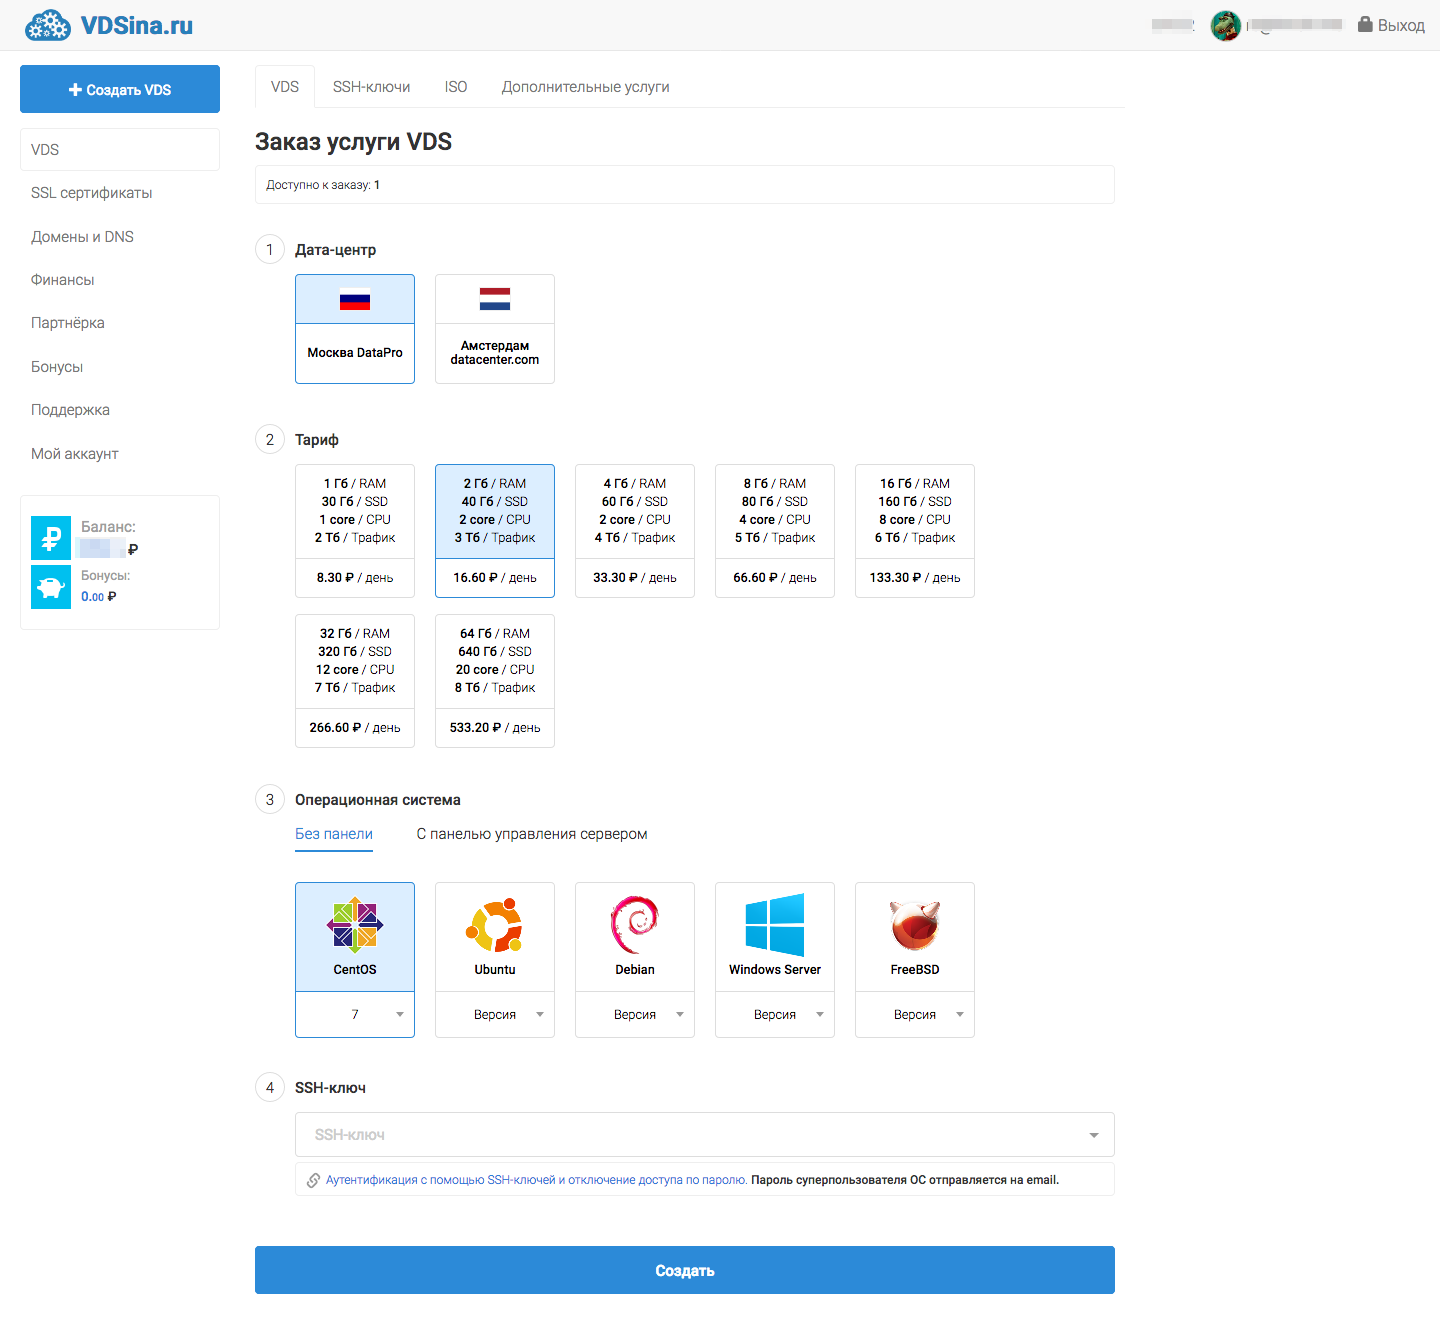
Решил тут затестить самый дешевый тариф VPS от VDS за 249 рублей в месяц. За эти деньги нам доступна виртуальная машина с 1 гигабайтом оперативной памяти, 1 ядром и 30 гигабайтами SSD. Ограничение по трафику - 2Тб в месяц.
Панель управления
Есть возможность заказа VDS в двух ДЦ в Москве и Амстердаме. Также есть возможность заказа VDS с Windows.
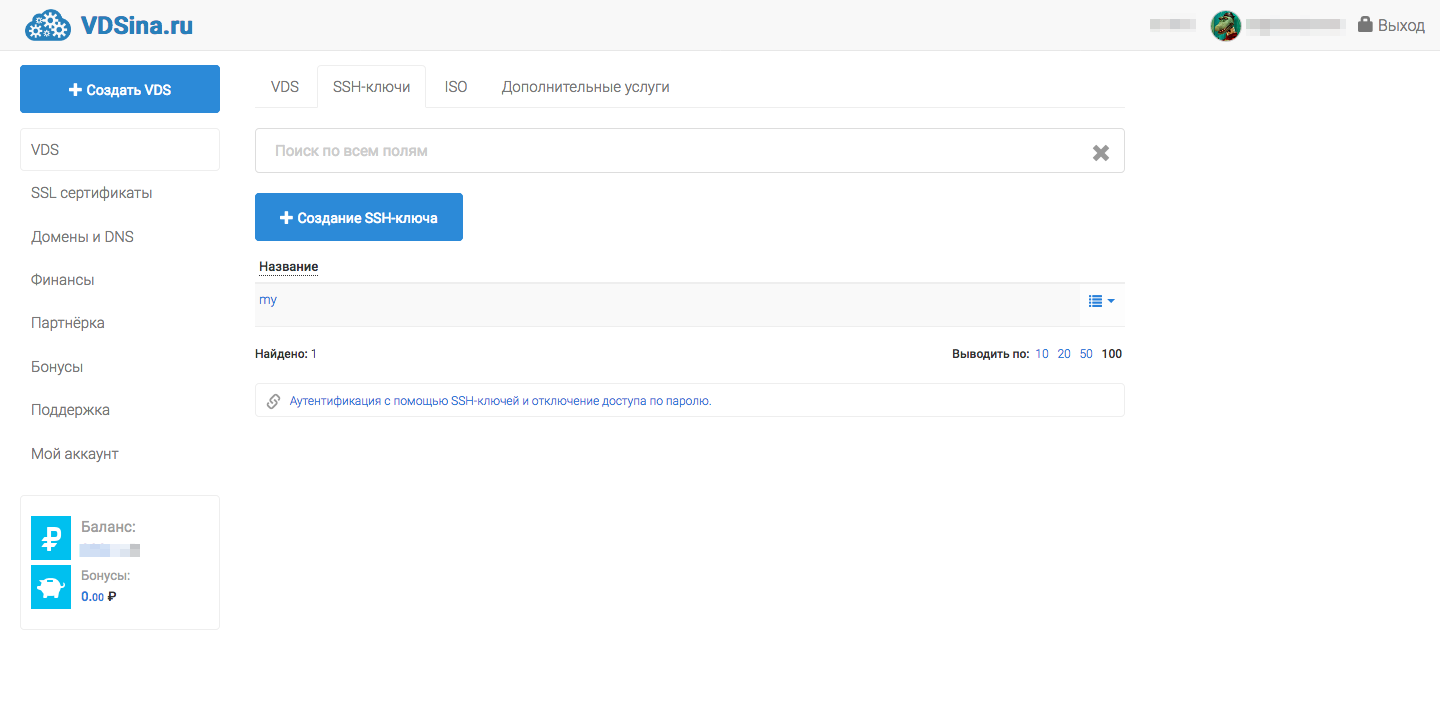
Можно добавить свой SSH-ключ
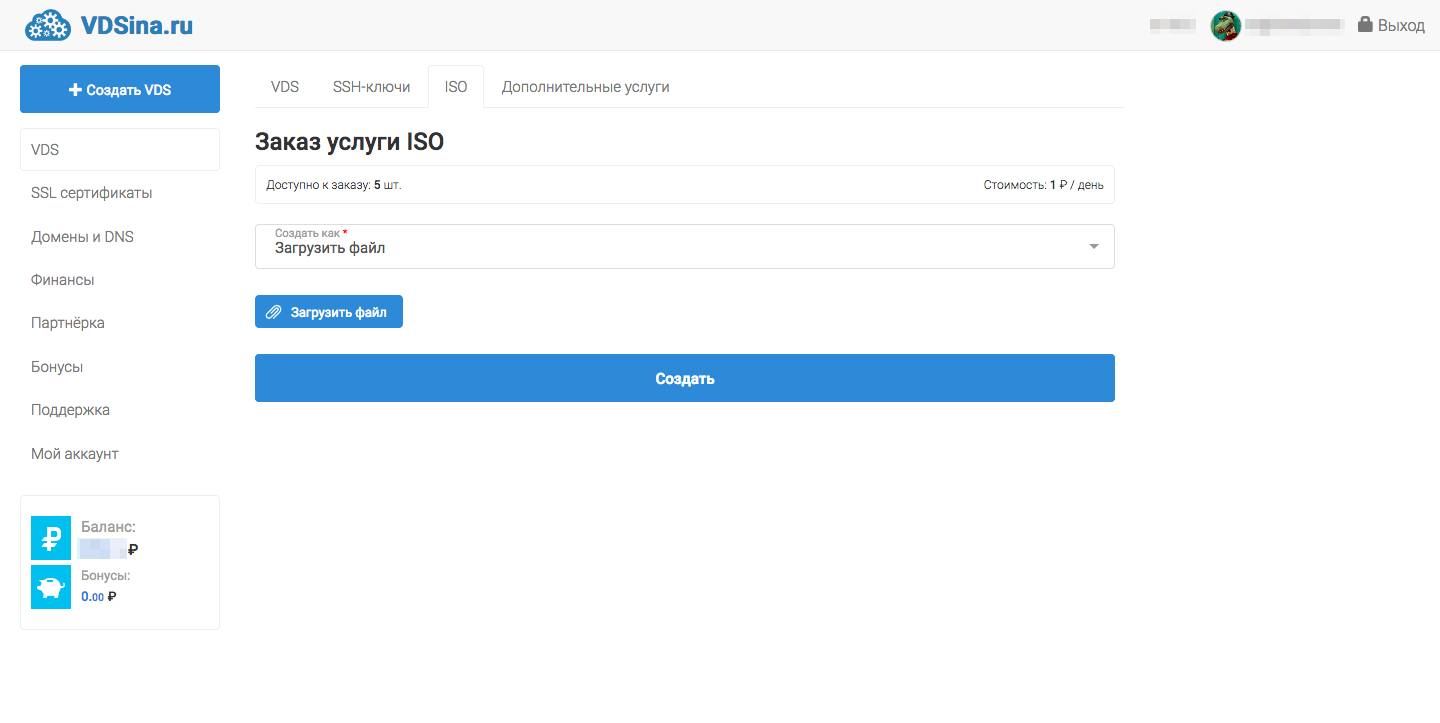
Можно загрузить свой ISO
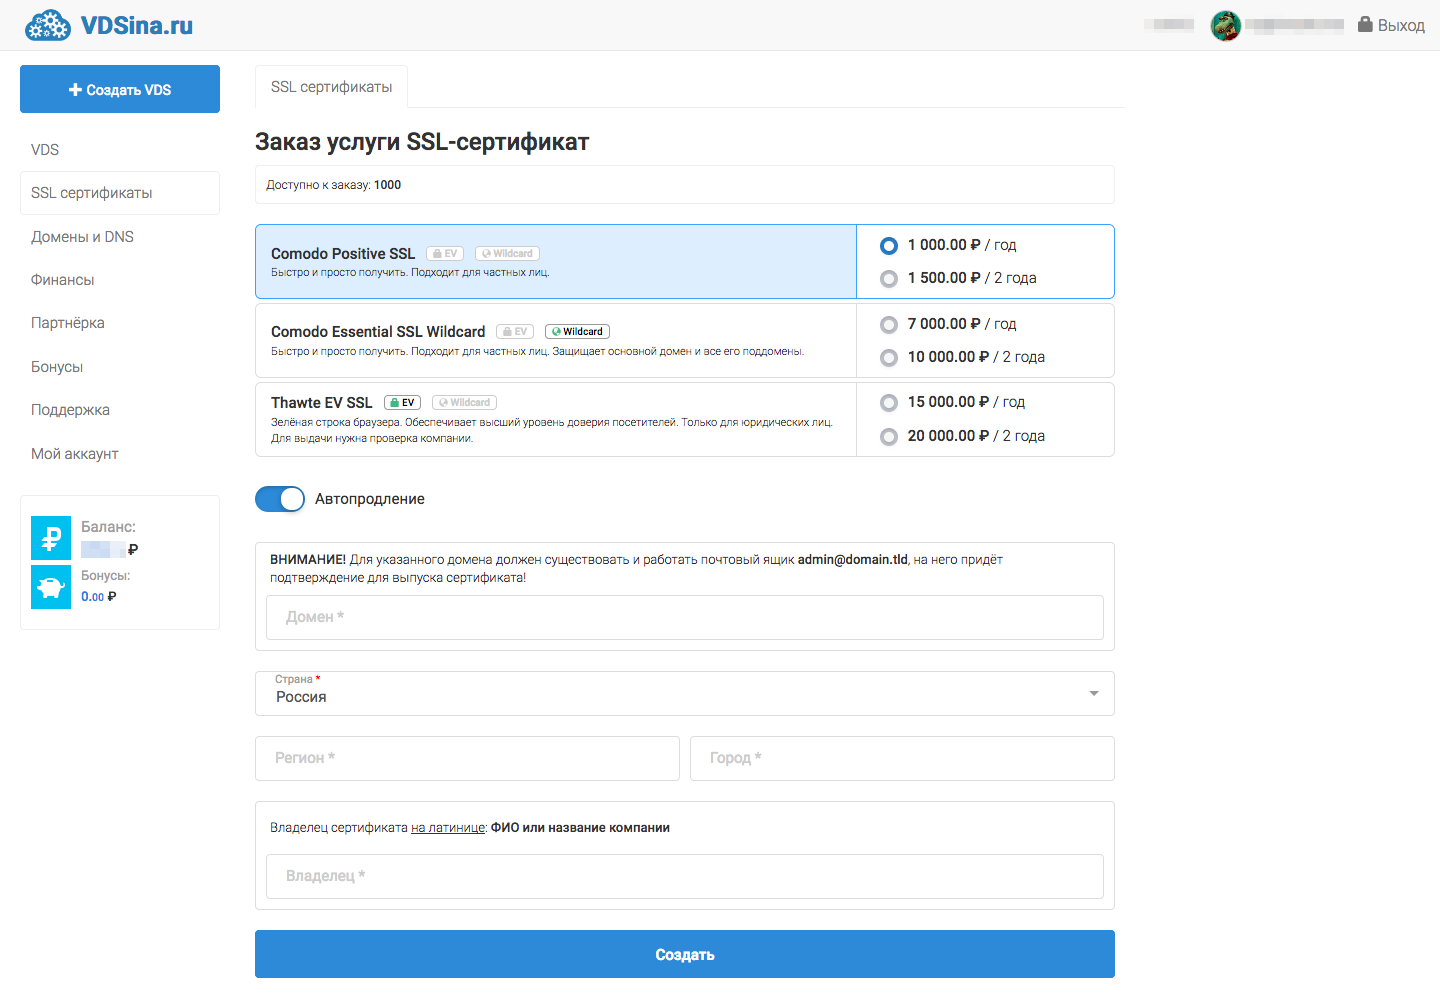
Есть возможность купить свой SSL
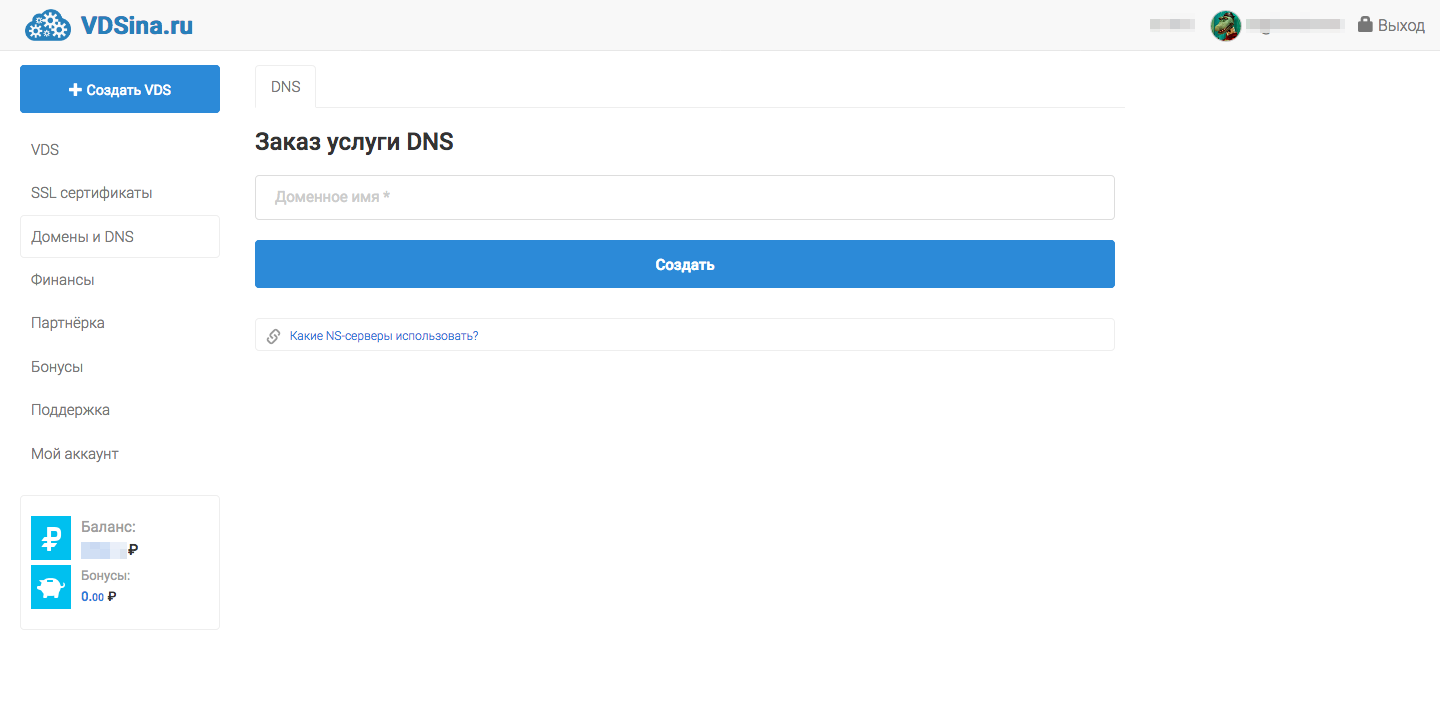
Есть возможность использования DNS хостера
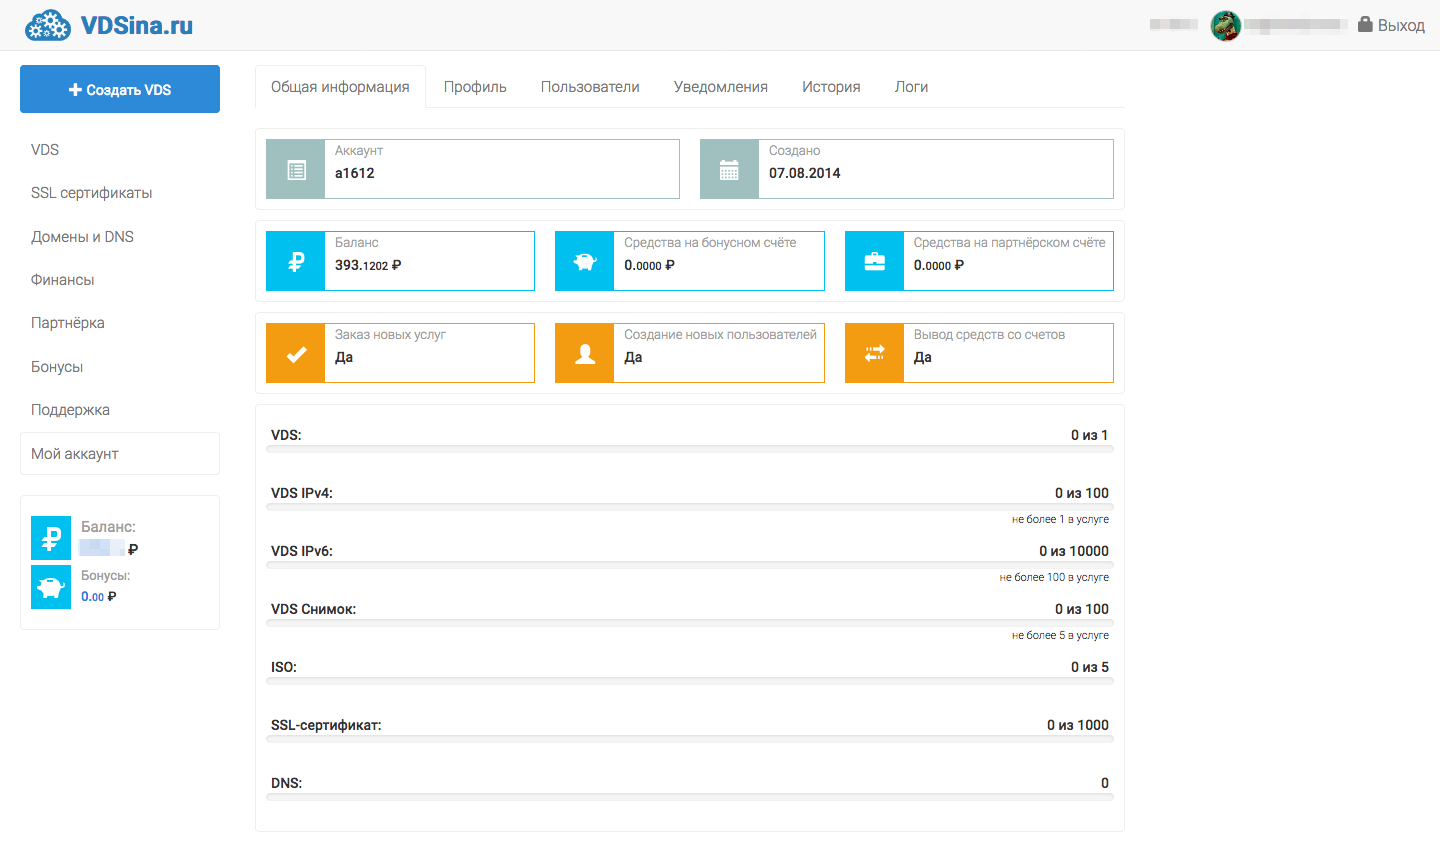
Общая информация по аккаунту. Есть лимиты
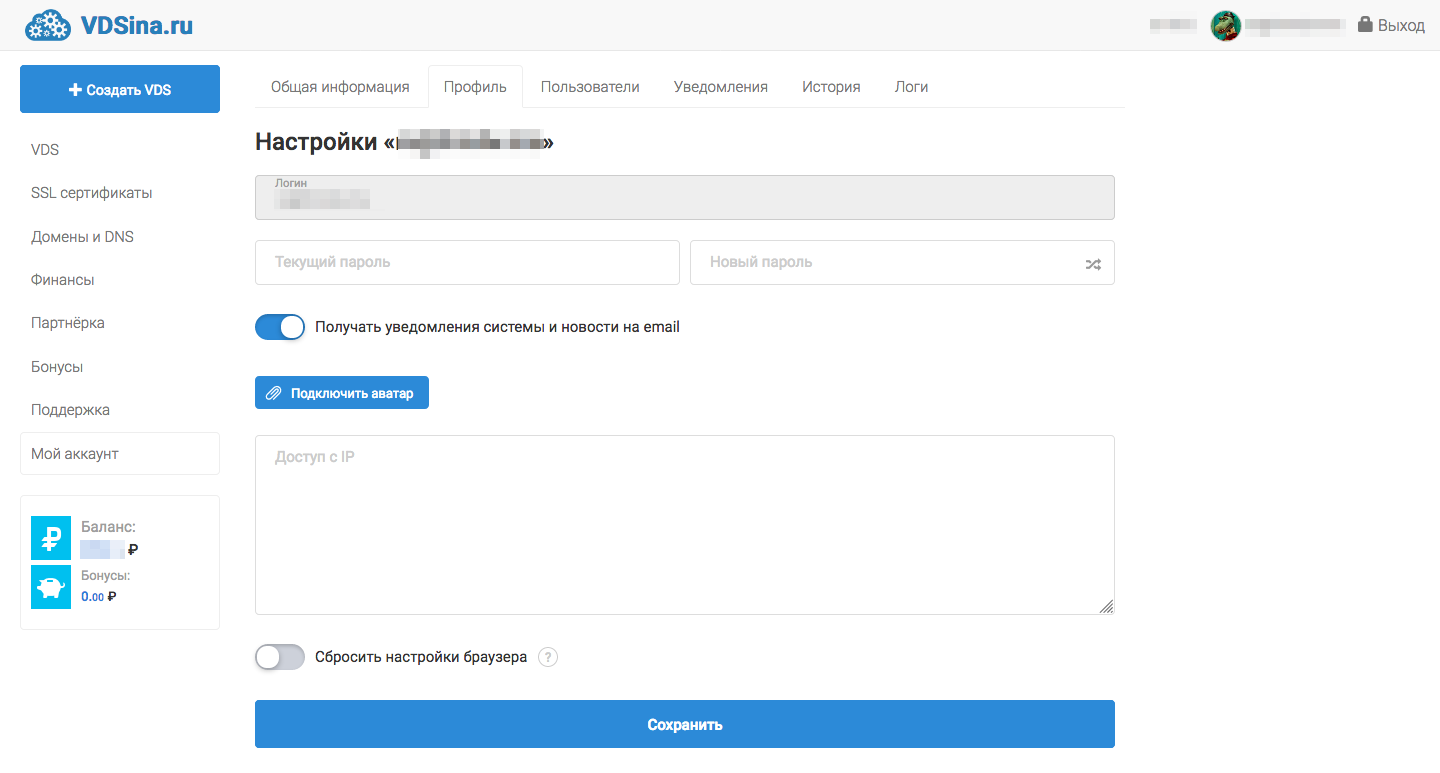
Можно ограничить доступ к аккаунту по ip
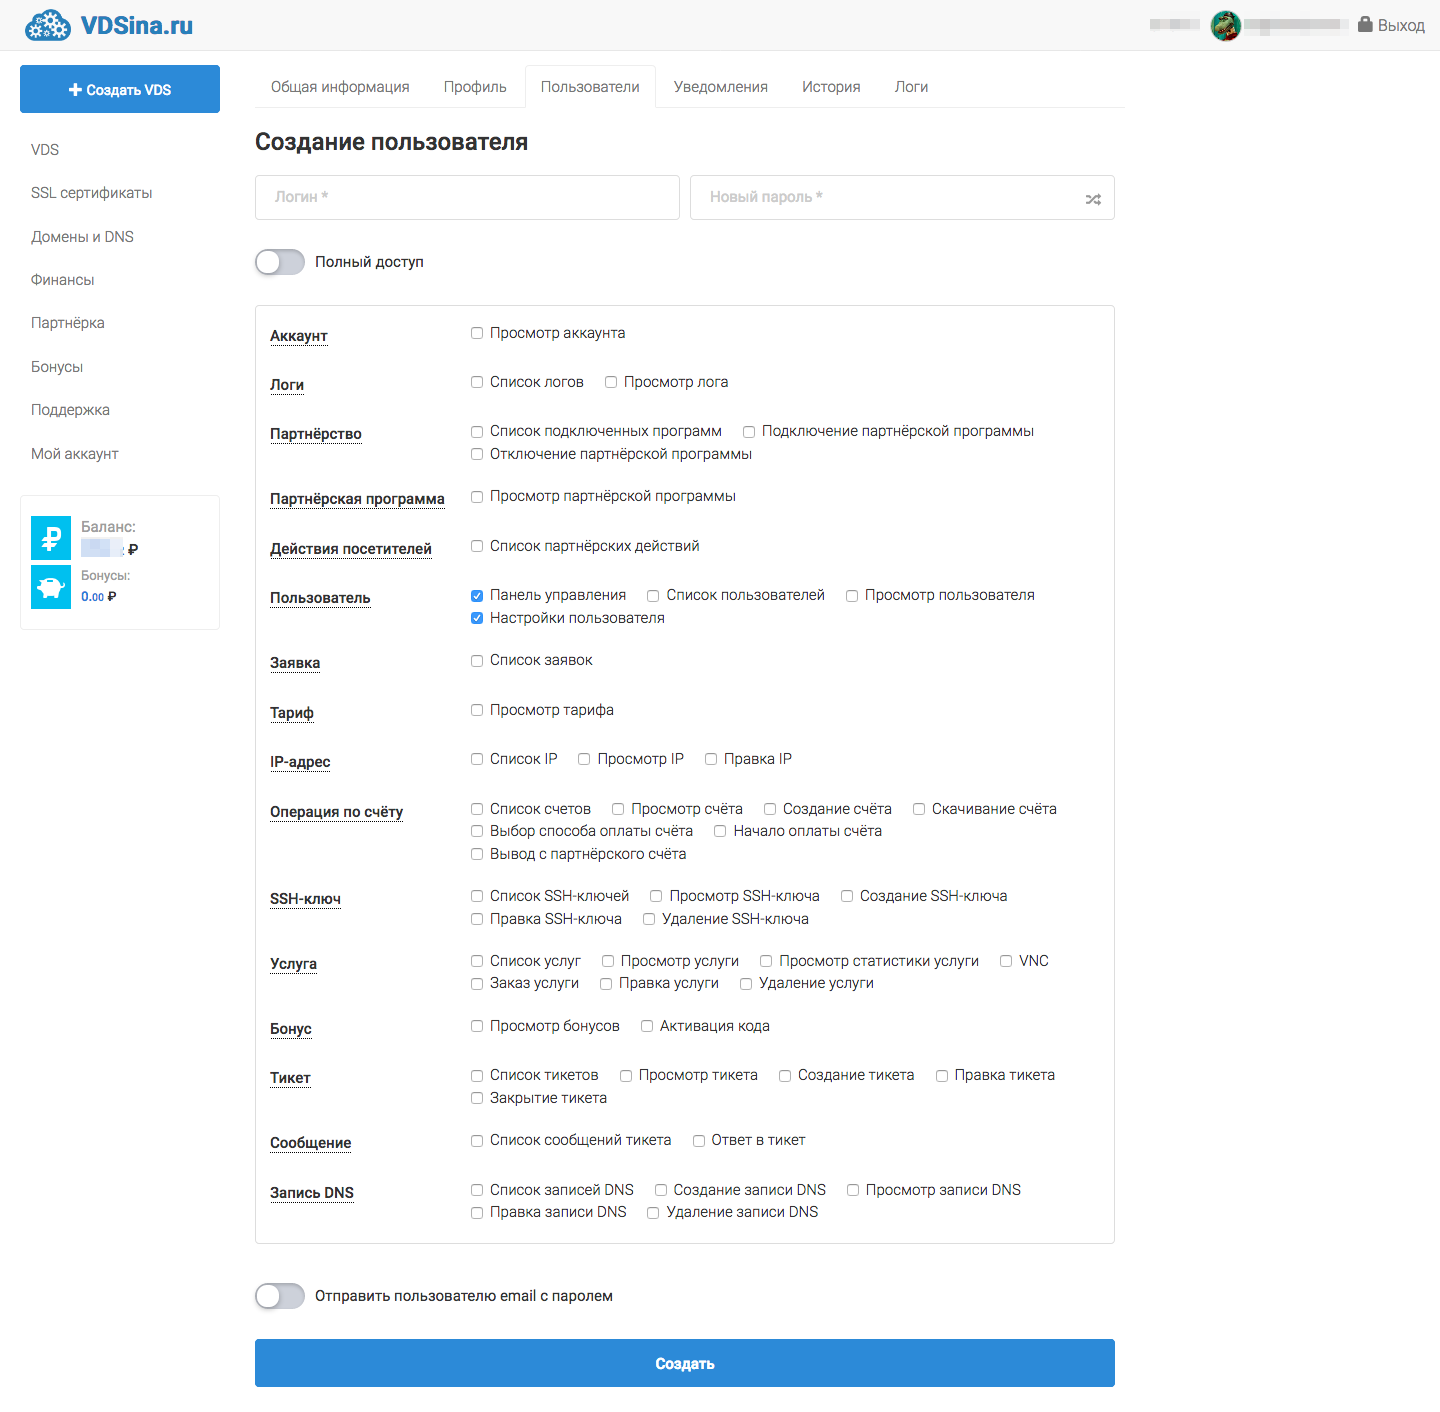
Можно создавать дополнительных пользователей
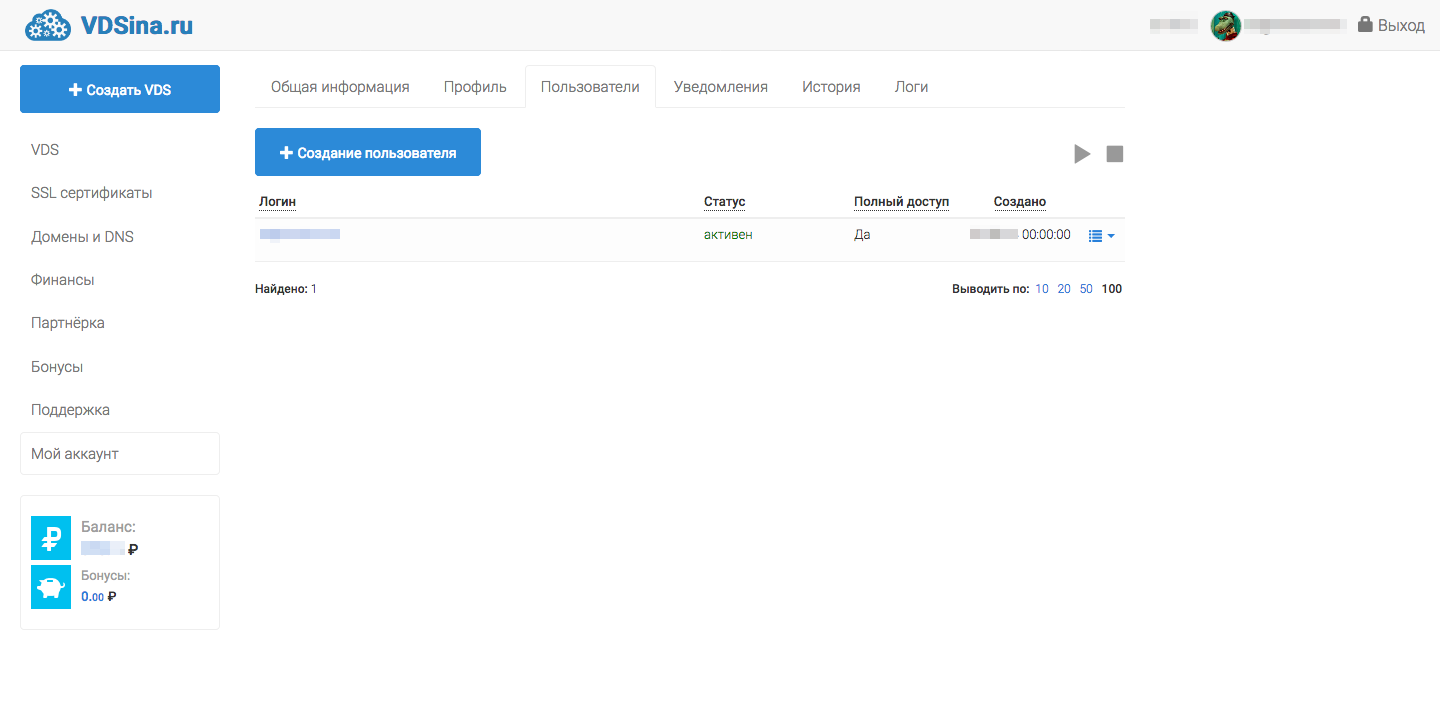
И гибко настраивать им права
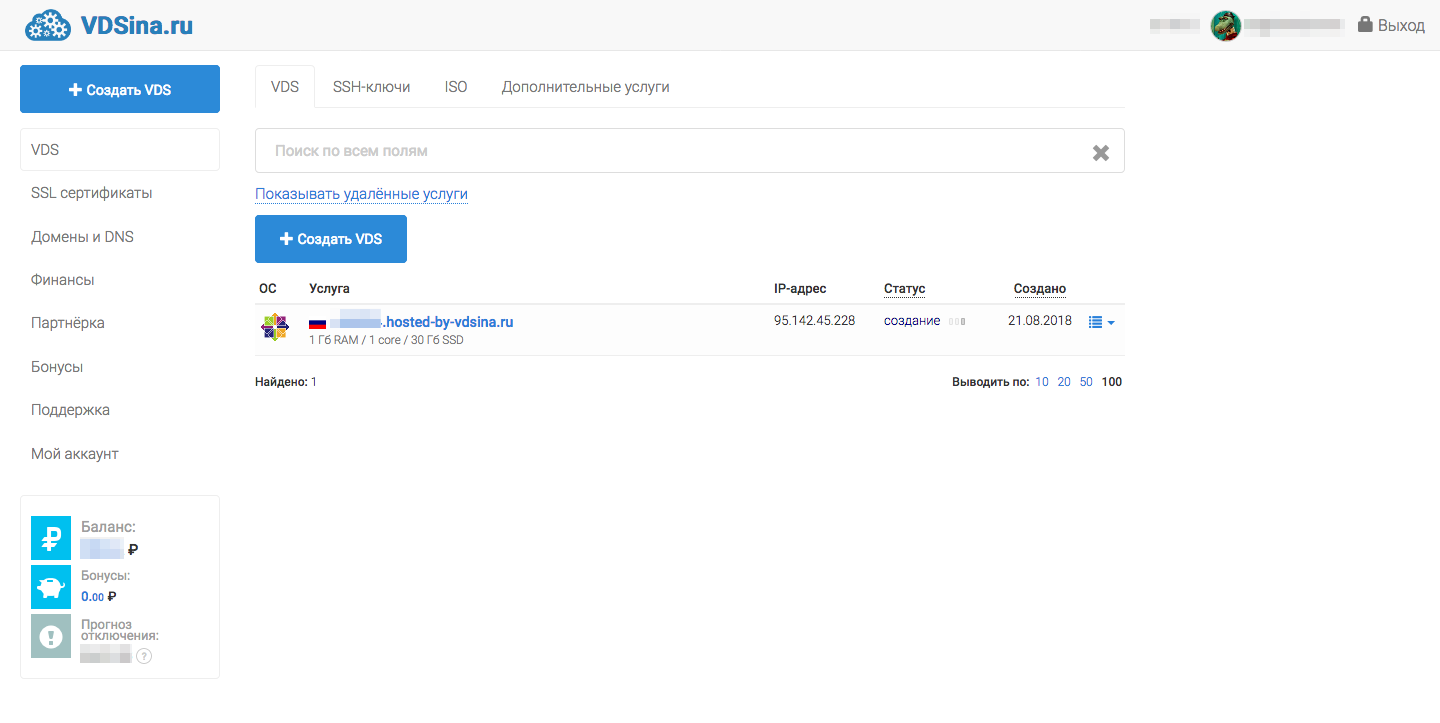
Заказанная тестовая VDS
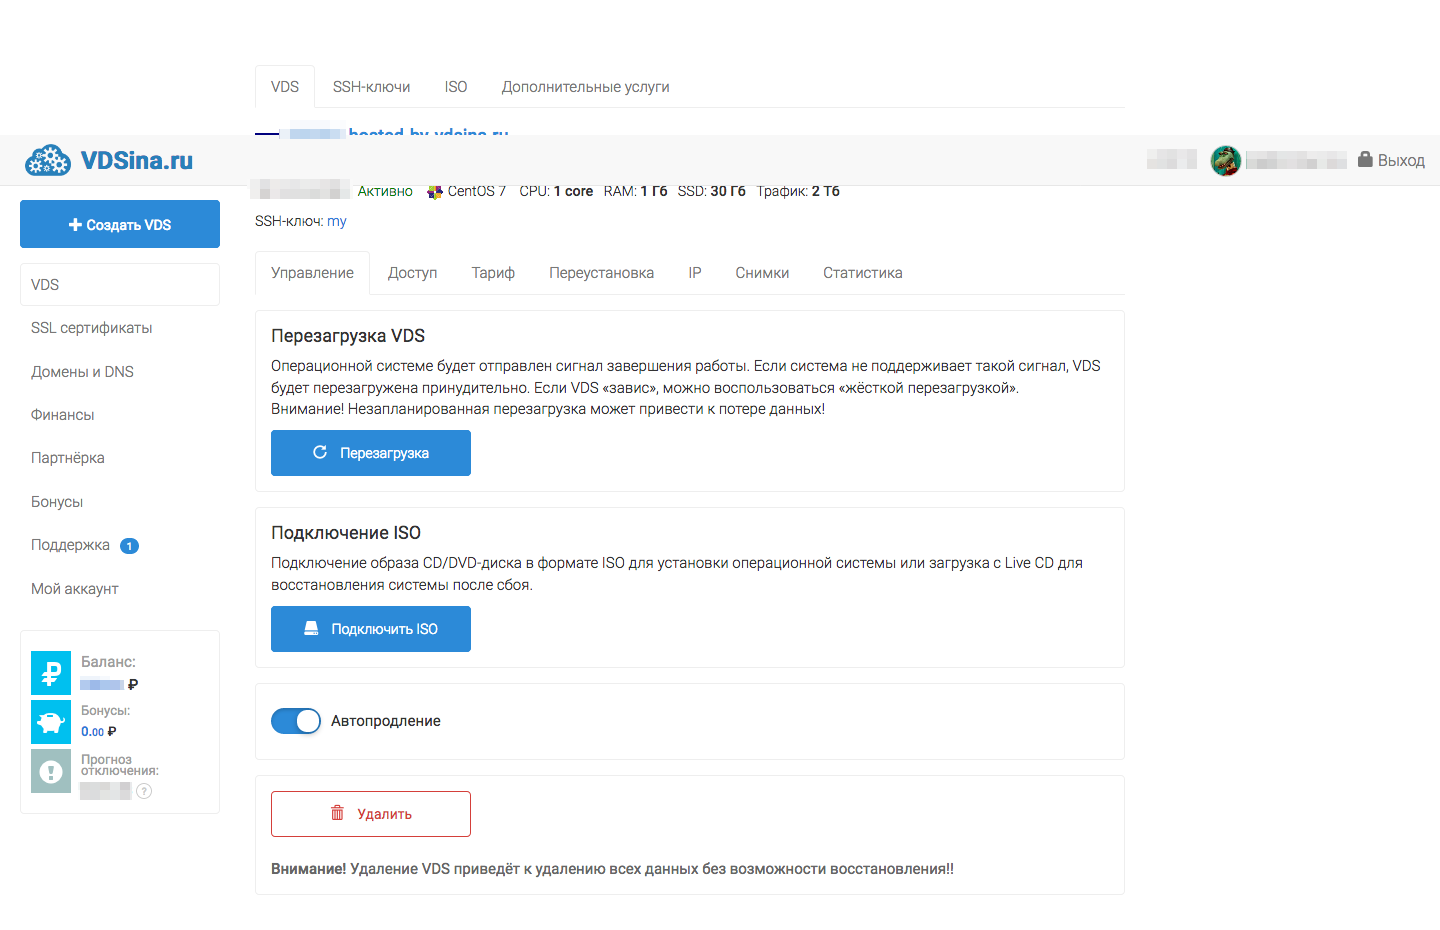
Настройки VDS
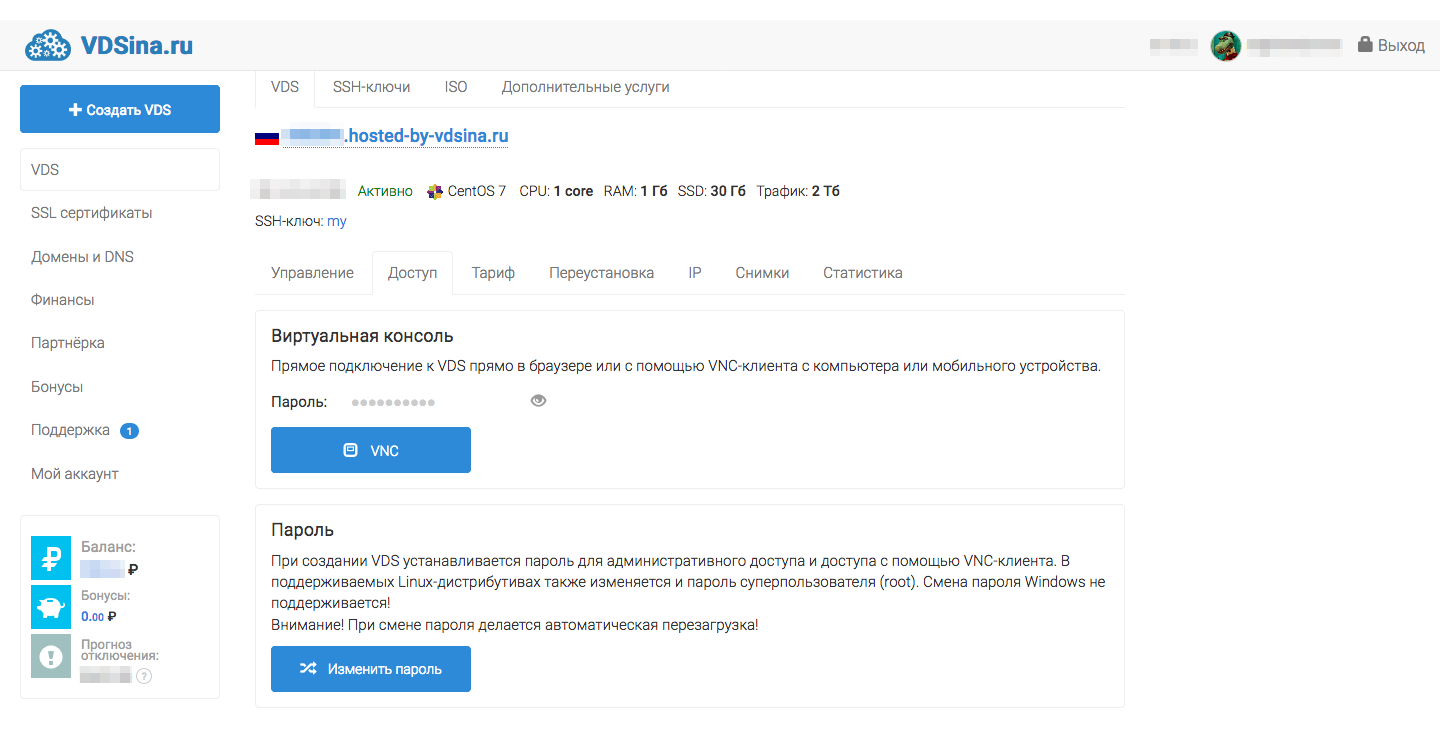
Есть возможность подключения к виртуалке по VNC
Есть возможность докупить IP
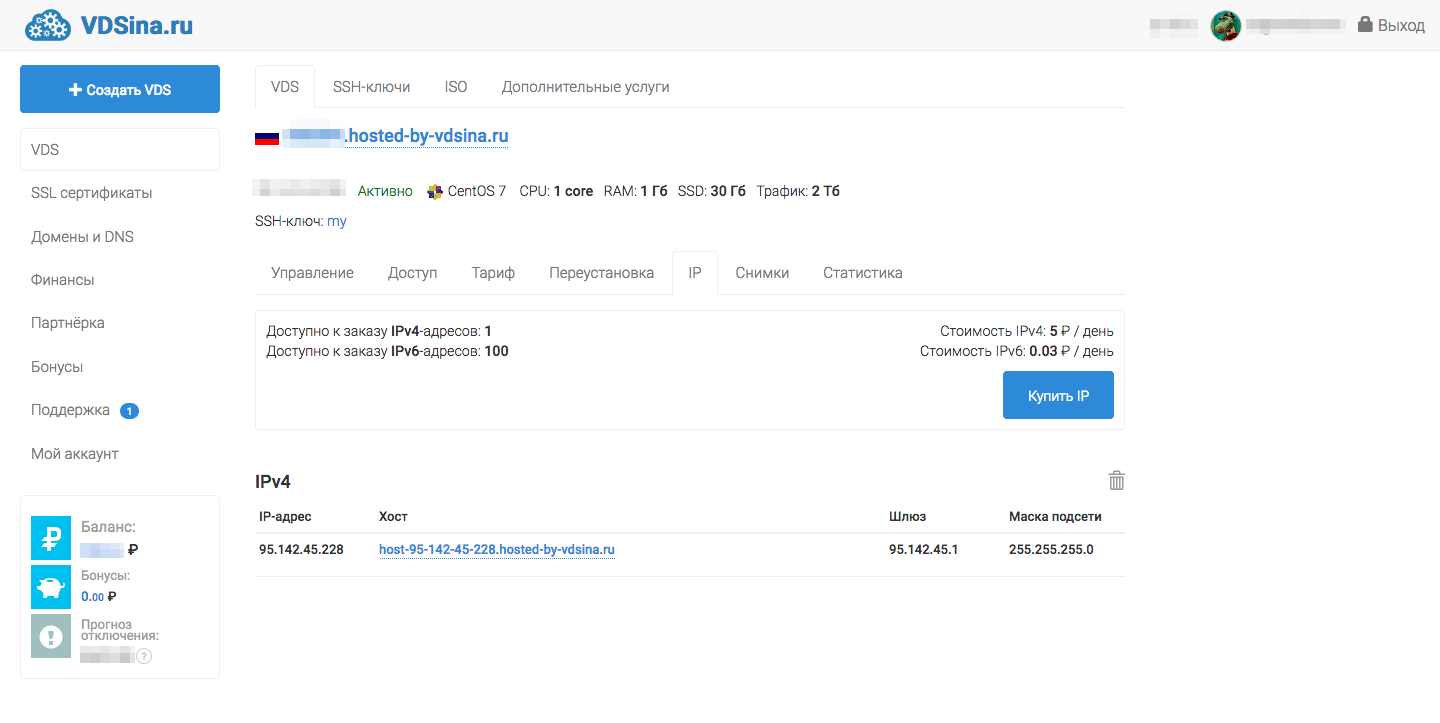
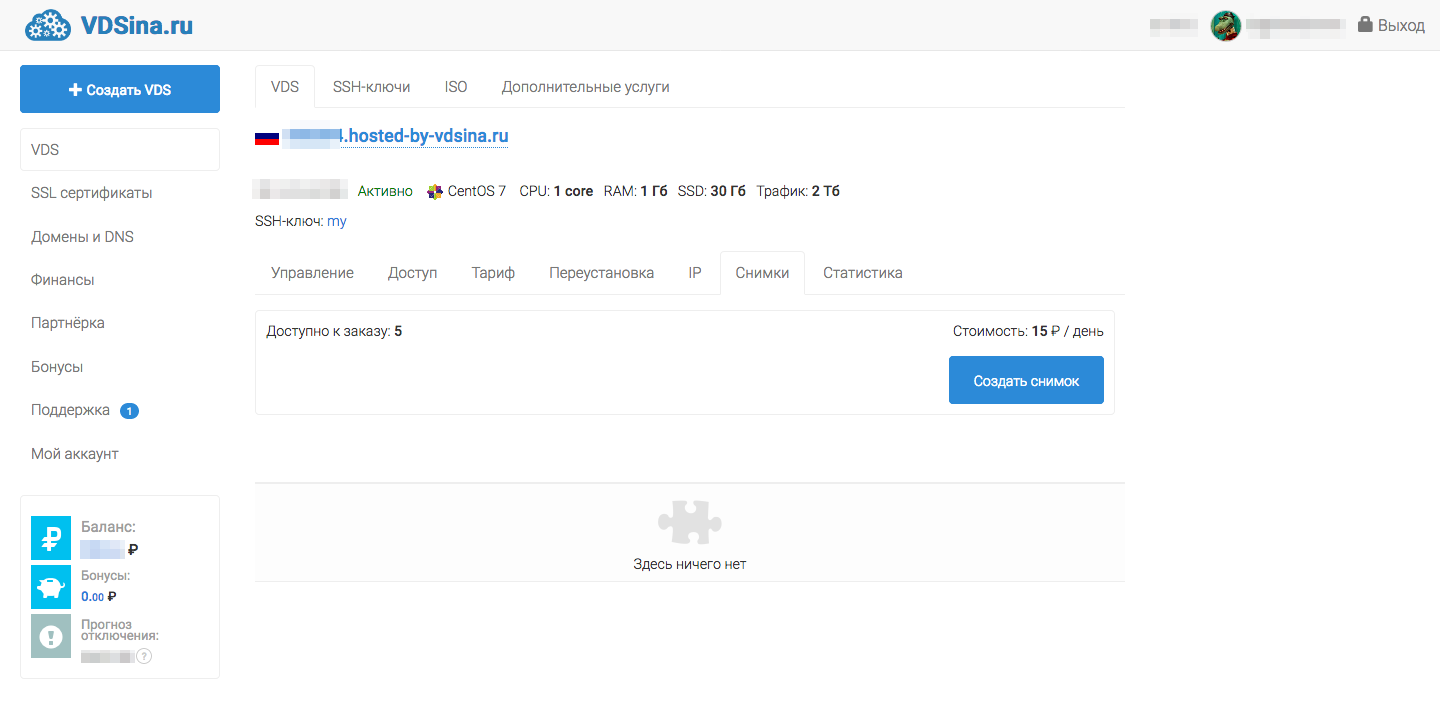
Есть возможность создавать снапшоты
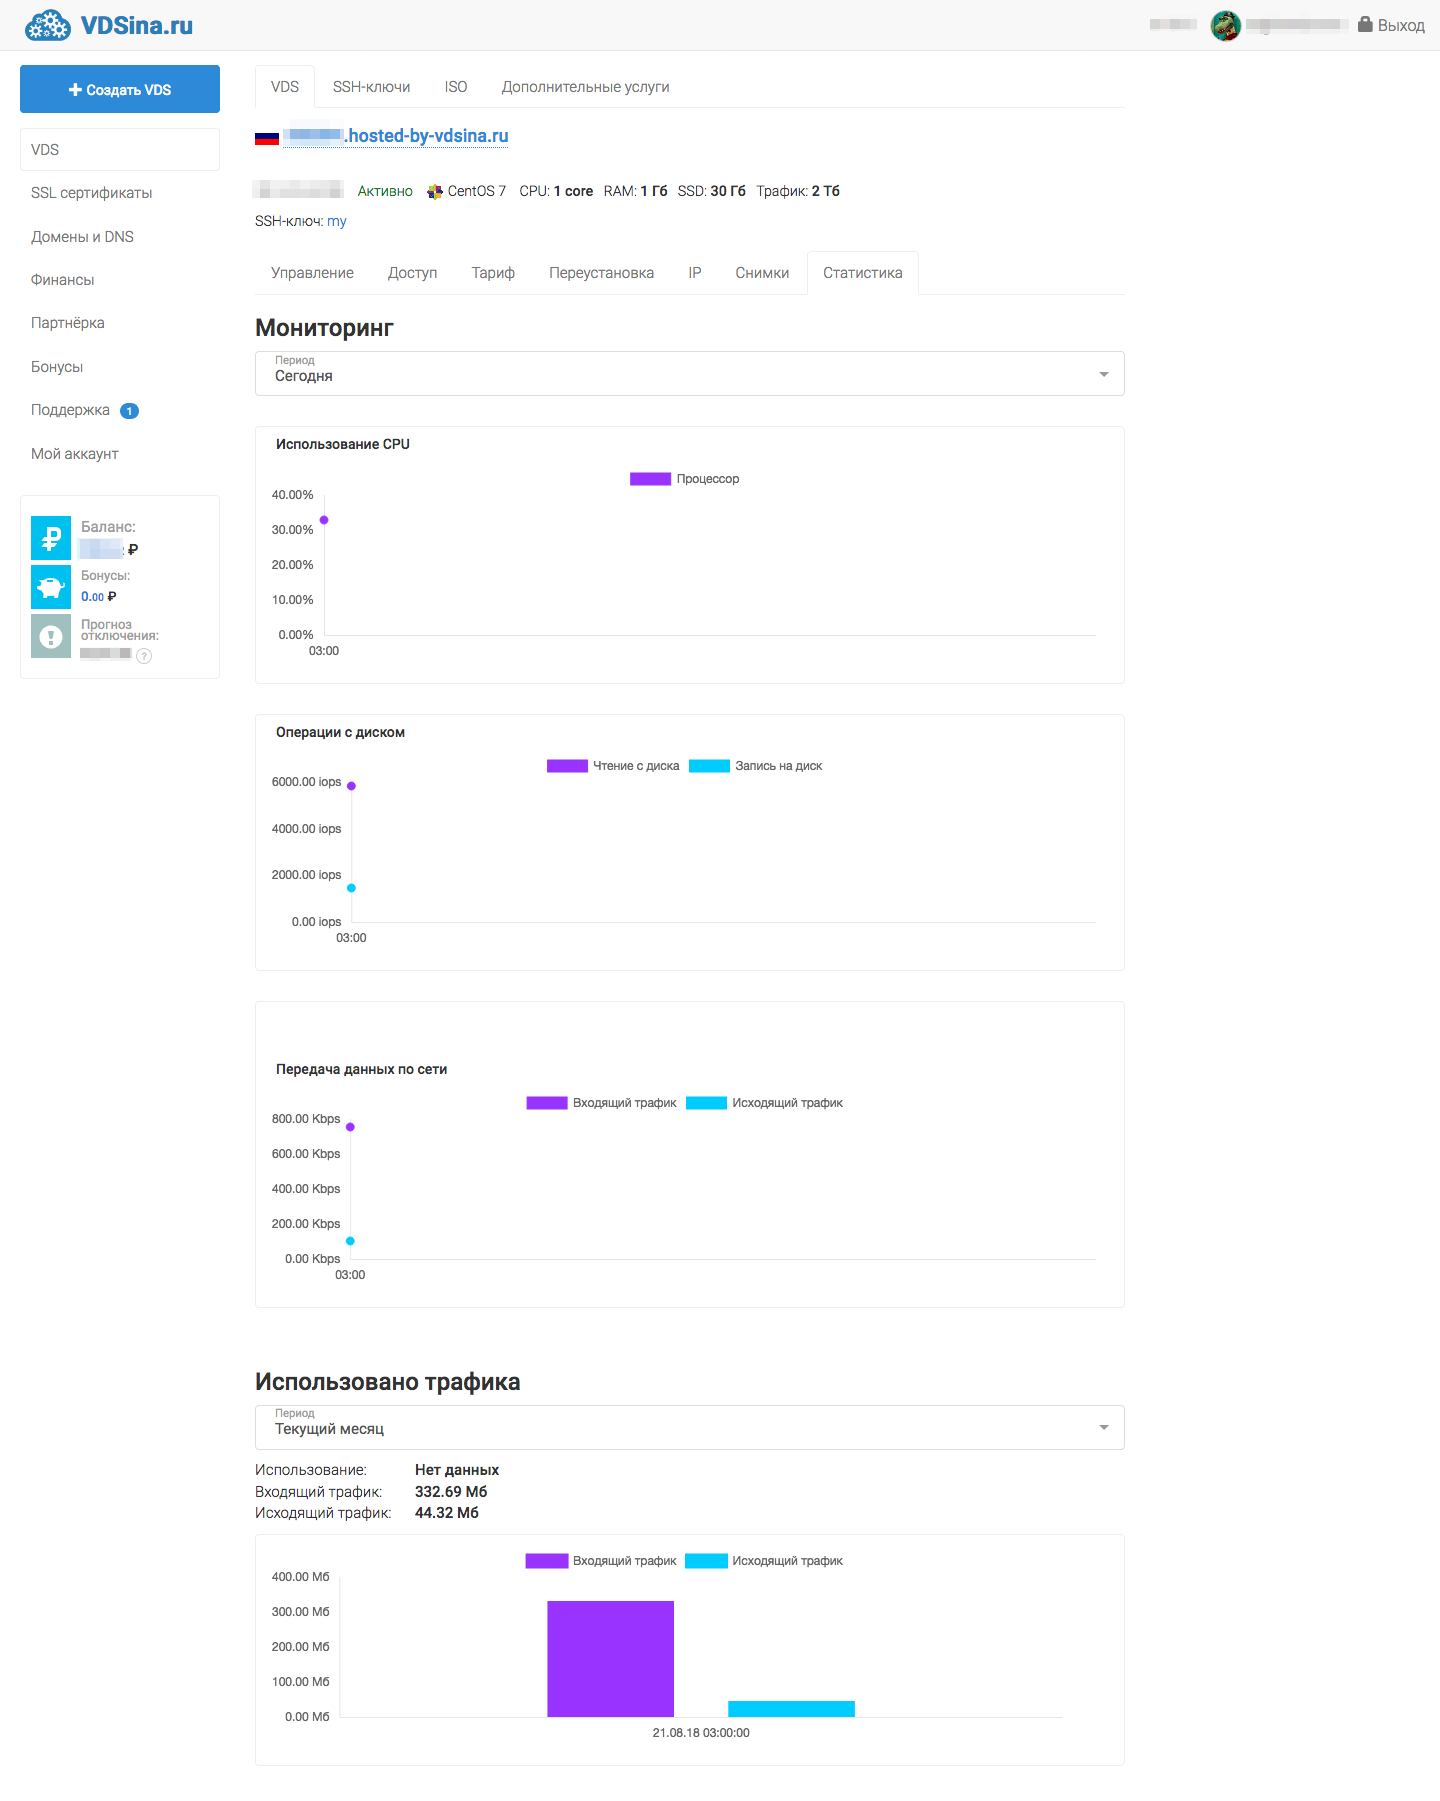
Можно смотреть статистику по использованию ресурсов на VDS
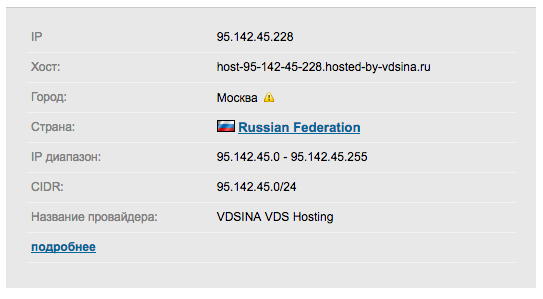
Сведения о VM
IP
CentOS 7.5
cat /etc/centos-release
-----------
CentOS Linux release 7.5.1804 (Core)
uname -a
-----------
Linux v88084.hosted-by-vdsina.ru 3.10.0-862.2.3.el7.x86_64 #1 SMP Wed May 9 18:05:47 UTC 2018 x86_64 x86_64 x86_64 GNU/Linux
Виртуализация KVM
inxi -b
-----------
System:    Host: v88084.hosted-by-vdsina.ru Kernel: 3.10.0-862.2.3.el7.x86_64 x86_64 bits: 64 Console: N/A
           Distro: CentOS Linux release 7.5.1804 (Core)
Machine:   Type: Kvm System: Red Hat product: KVM v: RHEL 6.6.0 PC serial: N/A
           Mobo: N/A model: N/A serial: N/A BIOS: Seabios v: 0.5.1 date: 01/01/2007
CPU:       Single Core: Common KVM type: MCP speed: 2095 MHz
Graphics:  Card-1: Cirrus Logic GD 5446 driver: cirrus v: kernel
           Display: server: No display server data found. Headless machine? tty: 204x24
           Message: Unable to show advanced data. Required tool glxinfo missing.
Network:   Card-1: Intel 82371AB/EB/MB PIIX4 ACPI type: network bridge driver: piix4_smbus
           Card-2: Red Hat Virtio network driver: virtio-pci
Drives:    Local Storage: total: 30.00 GiB used: 1.42 GiB (4.7%)
Info:      Processes: 67 Uptime: 1h 21m Memory: 991.8 MiB used: 122.7 MiB (12.4%) Init: systemd runlevel: 3
           Shell: clstr_test.sh inxi: 3.0.20
CPU и ОЗУ
CPU Info:
====================================================
cat /proc/cpuinfo
-----------
processor : 0
vendor_id : GenuineIntel
cpu family  : 15
model   : 6
model name  : Common KVM processor
stepping  : 1
microcode : 0x1
cpu MHz   : 2095.076
cache size  : 4096 KB
physical id : 0
siblings  : 1
core id   : 0
cpu cores : 1
apicid    : 0
initial apicid  : 0
fpu   : yes
fpu_exception : yes
cpuid level : 7
wp    : yes
flags   : fpu de pse tsc msr pae mce cx8 apic sep mtrr pge mca cmov pat pse36 clflush mmx fxsr sse sse2 syscall nx lm constant_tsc nopl pni cx16 hypervisor lahf_lm
bogomips  : 4190.15
clflush size  : 64
cache_alignment : 128
address sizes : 46 bits physical, 48 bits virtual
power management:


Memory Info:
====================================================
cat /proc/meminfo
-----------
MemTotal:        1015552 kB
MemFree:          671348 kB
MemAvailable:     779656 kB
Buffers:            9496 kB
Cached:           224164 kB
SwapCached:            0 kB
Active:           174812 kB
Inactive:         117152 kB
Active(anon):      59008 kB
Inactive(anon):     6084 kB
Active(file):     115804 kB
Inactive(file):   111068 kB
Unevictable:           0 kB
Mlocked:               0 kB
SwapTotal:             0 kB
SwapFree:              0 kB
Dirty:                52 kB
Writeback:             0 kB
AnonPages:         58344 kB
Mapped:            13124 kB
Shmem:              6776 kB
Slab:              28088 kB
SReclaimable:      18452 kB
SUnreclaim:         9636 kB
KernelStack:        1360 kB
PageTables:         3832 kB
NFS_Unstable:          0 kB
Bounce:                0 kB
WritebackTmp:          0 kB
CommitLimit:      507776 kB
Committed_AS:     228264 kB
VmallocTotal:   34359738367 kB
VmallocUsed:        8832 kB
VmallocChunk:   34359719676 kB
HardwareCorrupted:     0 kB
AnonHugePages:      6144 kB
CmaTotal:              0 kB
CmaFree:               0 kB
HugePages_Total:       0
HugePages_Free:        0
HugePages_Rsvd:        0
HugePages_Surp:        0
Hugepagesize:       2048 kB
DirectMap4k:       55284 kB
DirectMap2M:      993280 kB
Разметка диска
df -HT
-----------
Файловая система Тип      Размер Использовано  Дост Использовано% Cмонтировано в
/dev/vda1        ext4        32G         1,6G   29G            6% /
devtmpfs         devtmpfs   508M            0  508M            0% /dev
tmpfs            tmpfs      520M            0  520M            0% /dev/shm
tmpfs            tmpfs      520M         7,0M  514M            2% /run
tmpfs            tmpfs      520M            0  520M            0% /sys/fs/cgroup
tmpfs            tmpfs      104M            0  104M            0% /run/user/0
PT Summary
pt-summary
-----------
# Percona Toolkit System Summary Report ######################
        Date | 2018-08-21 00:36:06 UTC (local TZ: MSK +0300)
    Hostname | v88084.hosted-by-vdsina.ru
      Uptime |  1:21,  1 user,  load average: 0,10, 1,38, 1,16
      System | Red Hat; KVM; vRHEL 6.6.0 PC (Other)
 Service Tag | Not Specified
    Platform | Linux
     Release | CentOS Linux release 7.5.1804 (Core)
      Kernel | 3.10.0-862.2.3.el7.x86_64
Architecture | CPU = 64-bit, OS = 64-bit
   Threading | NPTL 2.17
     SELinux | Disabled
 Virtualized | VMWare
# Processor ##################################################
  Processors | physical = 1, cores = 1, virtual = 1, hyperthreading = no
      Speeds | 1x2095.076
      Models | 1xCommon KVM processor
      Caches | 1x4096 KB
# Memory #####################################################
       Total | 991,8M
        Free | 651,2M
        Used | physical = 81,5M, swap allocated = 0,0, swap used = 0,0, virtual = 81,5M
      Shared | 6,6M
     Buffers | 259,1M
      Caches | 760,4M
       Dirty | 156 kB
     UsedRSS | 86,9M
  Swappiness | 30
 DirtyPolicy | 30, 10
 DirtyStatus | 0, 0
  Locator   Size     Speed             Form Factor   Type          Type Detail
  ========= ======== ================= ============= ============= ===========
  DIMM 0    1024 MB                    DIMM          RAM           None
# Mounted Filesystems ########################################
  Filesystem  Size Used Type     Opts                                             Mountpoint
  devtmpfs    485M   0% devtmpfs rw,nosuid,size=496004k,nr_inodes=124001,mode=755 /dev
  /dev/vda1    30G   6% ext4     rw,relatime,data=ordered                         /
  tmpfs       100M   0% tmpfs    rw,nosuid,nodev                                  /run/user/0
  tmpfs       100M   0% tmpfs    rw,nosuid,nodev,mode=755                         /run/user/0
  tmpfs       100M   0% tmpfs    rw,nosuid,nodev,relatime,size=101556k,mode=700   /run/user/0
  tmpfs       100M   0% tmpfs    ro,nosuid,nodev,noexec,mode=755                  /run/user/0
  tmpfs       496M   0% tmpfs    rw,nosuid,nodev                                  /dev/shm
  tmpfs       496M   0% tmpfs    rw,nosuid,nodev,mode=755                         /dev/shm
  tmpfs       496M   0% tmpfs    rw,nosuid,nodev,relatime,size=101556k,mode=700   /dev/shm
  tmpfs       496M   0% tmpfs    ro,nosuid,nodev,noexec,mode=755                  /dev/shm
  tmpfs       496M   0% tmpfs    rw,nosuid,nodev                                  /sys/fs/cgroup
  tmpfs       496M   0% tmpfs    rw,nosuid,nodev,mode=755                         /sys/fs/cgroup
  tmpfs       496M   0% tmpfs    rw,nosuid,nodev,relatime,size=101556k,mode=700   /sys/fs/cgroup
  tmpfs       496M   0% tmpfs    ro,nosuid,nodev,noexec,mode=755                  /sys/fs/cgroup
  tmpfs       496M   2% tmpfs    rw,nosuid,nodev                                  /run
  tmpfs       496M   2% tmpfs    rw,nosuid,nodev,mode=755                         /run
  tmpfs       496M   2% tmpfs    rw,nosuid,nodev,relatime,size=101556k,mode=700   /run
  tmpfs       496M   2% tmpfs    ro,nosuid,nodev,noexec,mode=755                  /run
# Disk Schedulers And Queue Size #############################
         vda | [mq-deadline] 256
# Disk Partioning ############################################
Device       Type      Start        End               Size
============ ==== ========== ========== ==================
/dev/vda     Disk                              32212254720
/dev/vda1    Part       2048   62914559        32211205632
# Kernel Inode State #########################################
dentry-state | 16986  8659  45  0 0 0
     file-nr | 1024 0 97886
    inode-nr | 16637  3054
# LVM Volumes ################################################
Unable to collect information
# LVM Volume Groups ##########################################
Unable to collect information
# RAID Controller ############################################
  Controller | No RAID controller detected
# Network Config #############################################
  Controller | Red Hat, Inc. Virtio network device
 FIN Timeout | 60
  Port Range | 60999
# Interface Statistics #######################################
  interface  rx_bytes rx_packets  rx_errors   tx_bytes tx_packets  tx_errors
  ========= ========= ========== ========== ========== ========== ==========
  lo             6000         60          0       6000         60          0
  eth0      350000000     250000          0   45000000     125000          0
# Network Devices ############################################
  Device    Speed     Duplex
  ========= ========= =========
  eth0
# Top Processes ##############################################
  PID USER      PR  NI    VIRT    RES    SHR S %CPU %MEM     TIME+ COMMAND
    1 root      20   0   51480   2316   1152 S  0,0  0,2   0:01.61 systemd
    2 root      20   0       0      0      0 S  0,0  0,0   0:00.00 kthreadd
    3 root      20   0       0      0      0 S  0,0  0,0   0:00.25 ksoftirqd/0
    5 root       0 -20       0      0      0 S  0,0  0,0   0:00.00 kworker/0:0H
    6 root      20   0       0      0      0 S  0,0  0,0   0:02.70 kworker/u2:0
    7 root      rt   0       0      0      0 S  0,0  0,0   0:00.00 migration/0
    8 root      20   0       0      0      0 S  0,0  0,0   0:00.00 rcu_bh
    9 root      20   0       0      0      0 S  0,0  0,0   0:02.08 rcu_sched
   10 root       0 -20       0      0      0 S  0,0  0,0   0:00.00 lru-add-dra+
# Notable Processes ##########################################
  PID    OOM    COMMAND
  785    -17    sshd
# Memory mamagement ##########################################
Transparent huge pages are enabled.
# The End ####################################################
Тесты
DD
dd if=/dev/zero of=test bs=64k count=16k conv=fdatasync 2>&1
rm -f test
-----------
16384+0 записей получено
16384+0 записей отправлено
 скопировано 1073741824 байта (1,1 GB), 1,1648 c, 922 MB/c
16384+0 записей получено
16384+0 записей отправлено
 скопировано 1073741824 байта (1,1 GB), 1,04657 c, 1,0 GB/c
16384+0 записей получено
16384+0 записей отправлено
 скопировано 1073741824 байта (1,1 GB), 1,05506 c, 1,0 GB/c
Sysbench тест CPU
sysbench cpu --cpu-max-prime=20000 --num-threads=1 run
-----------
sysbench 1.0.15 (using bundled LuaJIT 2.1.0-beta2)

Running the test with following options:
Number of threads: 1
Initializing random number generator from current time


Prime numbers limit: 20000

Initializing worker threads...

Threads started!

CPU speed:
    events per second:   288.13

General statistics:
    total time:                          10.0036s
    total number of events:              2883

Latency (ms):
         min:                                    3.23
         avg:                                    3.47
         max:                                    4.90
         95th percentile:                        3.89
         sum:                                 9994.40

Threads fairness:
    events (avg/stddev):           2883.0000/0.00
    execution time (avg/stddev):   9.9944/0.00
sysbench mutex --threads=64 run
-----------
sysbench 1.0.15 (using bundled LuaJIT 2.1.0-beta2)

Running the test with following options:
Number of threads: 64
Initializing random number generator from current time


Initializing worker threads...

Threads started!


General statistics:
    total time:                          19.0590s
    total number of events:              64

Latency (ms):
         min:                                17068.74
         avg:                                18315.27
         max:                                18899.23
         95th percentile:                    18738.17
         sum:                              1172177.58

Threads fairness:
    events (avg/stddev):           1.0000/0.00
    execution time (avg/stddev):   18.3153/0.40
Sysbench тест ОЗУ
sysbench memory --num-threads=4 --memory-total-size=1G run
-----------
WARNING: --num-threads is deprecated, use --threads instead
sysbench 1.0.15 (using bundled LuaJIT 2.1.0-beta2)

Running the test with following options:
Number of threads: 4
Initializing random number generator from current time


Running memory speed test with the following options:
  block size: 1KiB
  total size: 1024MiB
  operation: write
  scope: global

Initializing worker threads...

Threads started!

Total operations: 1048576 (2734853.96 per second)

1024.00 MiB transferred (2670.76 MiB/sec)


General statistics:
    total time:                          0.3812s
    total number of events:              1048576

Latency (ms):
         min:                                    0.00
         avg:                                    0.00
         max:                                   33.11
         95th percentile:                        0.00
         sum:                                  700.05

Threads fairness:
    events (avg/stddev):           262144.0000/0.00
    execution time (avg/stddev):   0.1750/0.05
Sysbench тест диска
sysbench fileio --file-total-size=2G prepare
-----------
sysbench 1.0.15 (using bundled LuaJIT 2.1.0-beta2)

128 files, 16384Kb each, 2048Mb total
Creating files for the test...
Extra file open flags: (none)
Creating file test_file.0
...
Creating file test_file.127
2147483648 bytes written in 2.72 seconds (751.75 MiB/sec).
sysbench fileio --file-total-size=2G --file-test-mode=rndrw --time=300 --max-requests=0 run
-----------
sysbench 1.0.15 (using bundled LuaJIT 2.1.0-beta2)

Running the test with following options:
Number of threads: 1
Initializing random number generator from current time


Extra file open flags: (none)
128 files, 16MiB each
2GiB total file size
Block size 16KiB
Number of IO requests: 0
Read/Write ratio for combined random IO test: 1.50
Periodic FSYNC enabled, calling fsync() each 100 requests.
Calling fsync() at the end of test, Enabled.
Using synchronous I/O mode
Doing random r/w test
Initializing worker threads...

Threads started!


File operations:
    reads/s:                      2556.67
    writes/s:                     1704.45
    fsyncs/s:                     5454.49

Throughput:
    read, MiB/s:                  39.95
    written, MiB/s:               26.63

General statistics:
    total time:                          300.0218s
    total number of events:              2914790

Latency (ms):
         min:                                    0.00
         avg:                                    0.10
         max:                                   15.02
         95th percentile:                        0.29
         sum:                               296488.97

Threads fairness:
    events (avg/stddev):           2914790.0000/0.00
    execution time (avg/stddev):   296.4890/0.00
SpeedTest
speedtest-cli
-----------
Retrieving speedtest.net configuration...
Testing from McHost.Ru (95.142.45.228)...
Retrieving speedtest.net server list...
Selecting best server based on ping...
Hosted by Megafon (Moscow) [1.61 km]: 6.268 ms
Testing download speed................................................................................
Download: 93.09 Mbit/s
Testing upload speed....................................................................................................
Upload: 145.15 Mbit/s
Пинг из Ульяновска
rail$ ping 95.142.45.228
PING 95.142.45.228 (95.142.45.228): 56 data bytes
64 bytes from 95.142.45.228: icmp_seq=0 ttl=55 time=20.222 ms
64 bytes from 95.142.45.228: icmp_seq=1 ttl=55 time=20.483 ms
64 bytes from 95.142.45.228: icmp_seq=2 ttl=55 time=22.319 ms
64 bytes from 95.142.45.228: icmp_seq=3 ttl=55 time=21.132 ms
64 bytes from 95.142.45.228: icmp_seq=4 ttl=55 time=20.998 ms
64 bytes from 95.142.45.228: icmp_seq=5 ttl=55 time=21.105 ms
64 bytes from 95.142.45.228: icmp_seq=6 ttl=55 time=21.012 ms
64 bytes from 95.142.45.228: icmp_seq=7 ttl=55 time=20.291 ms
64 bytes from 95.142.45.228: icmp_seq=8 ttl=55 time=21.130 ms
64 bytes from 95.142.45.228: icmp_seq=9 ttl=55 time=20.297 ms
64 bytes from 95.142.45.228: icmp_seq=10 ttl=55 time=20.690 ms
^C
--- 95.142.45.228 ping statistics ---
11 packets transmitted, 11 packets received, 0.0% packet loss
round-trip min/avg/max/stddev = 20.222/20.880/22.319/0.571 ms
7-zip benchmark
7za b
-----------

7-Zip (a) [64] 16.02 : Copyright (c) 1999-2016 Igor Pavlov : 2016-05-21
p7zip Version 16.02 (locale=ru_RU.UTF-8,Utf16=on,HugeFiles=on,64 bits,1 CPU Common KVM processor (F61),ASM)

Common KVM processor (F61)
CPU Freq:  2320  2337  2343  2337  2332  2315  2326  2328  2323

RAM size:     991 MB,  # CPU hardware threads:   1
RAM usage:    435 MB,  # Benchmark threads:      1

                       Compressing  |                  Decompressing
Dict     Speed Usage    R/U Rating  |      Speed Usage    R/U Rating
         KiB/s     %   MIPS   MIPS  |      KiB/s     %   MIPS   MIPS

22:       2152   100   2086   2094  |      23131   100   1977   1975
23:       2054   100   2098   2093  |      23450   100   2033   2030
24:       2041   100   2200   2195  |      23388   100   2053   2053
25:       1858   100   2123   2122  |      22336   100   1992   1988
----------------------------------  | ------------------------------
Avr:             100   2126   2126  |              100   2014   2012
Tot:             100   2070   2069
Выводы
Быстрые сервера по адекватной цене. Также порадовала развесистая панель управления с кучей настроек.