![]()
Добрый день!
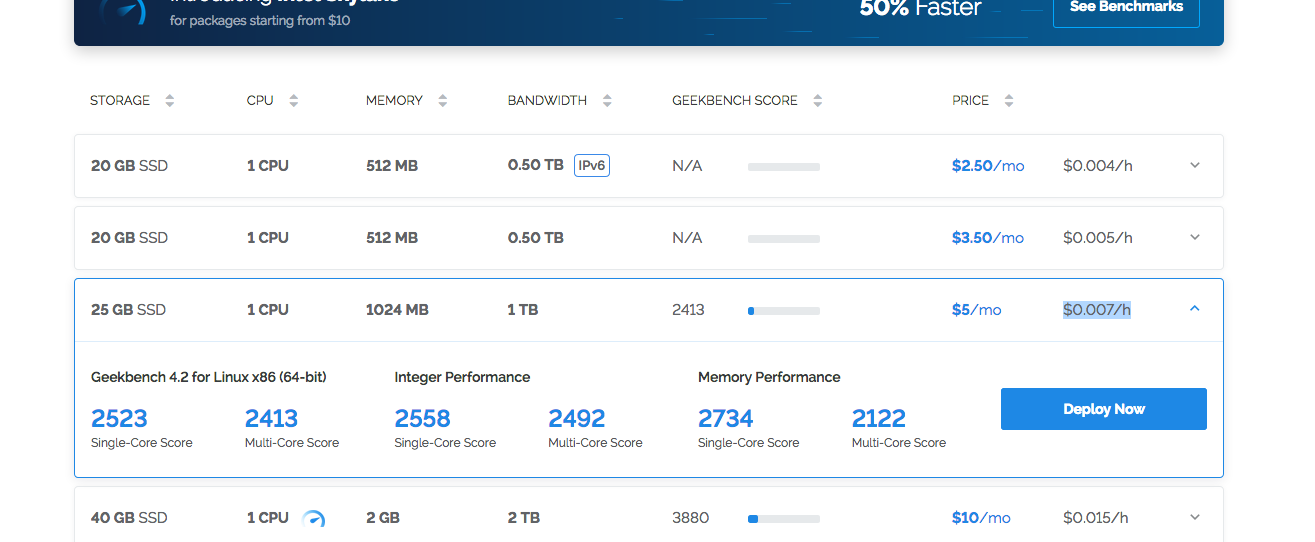
Решил тут потестить VPS от Vultr в локации Франкфурт. Стоимость такой виртуалки $5 в месяц (или $0.007 в час).
Это не самый дешевый тариф. Есть еще варианты c 512Mb RAM, 20Gb SSD и 1 ядром CPU за $2.5 (только с ipv6) и за $3.5 (с ipv4). Также стоит отметить что на виртуалках есть ограничение по трафику. 500 гигабайт в месяц на младших тарифах.
На протестированном же мной тарифе доступен трафик 1 терабайт в месяц.
Кстати на странице выбора тарифа на сайте хостера можно посмотреть результаты замеров в Geekbench 4.2:
Сведения о VM
CentOS 7.5
cat /etc/centos-release
-----------
CentOS Linux release 7.5.1804 (Core)
uname -a
-----------
Linux vultr.guest 3.10.0-862.3.2.el7.x86_64 #1 SMP Mon May 21 23:36:36 UTC 2018 x86_64 x86_64 x86_64 GNU/Linux
Виртуализация KVM
inxi -b
-----------
System:    Host: vultr.guest Kernel: 3.10.0-862.3.2.el7.x86_64 x86_64 bits: 64 Console: N/A
           Distro: CentOS Linux release 7.5.1804 (Core)
Machine:   Type: Kvm System: QEMU product: Standard PC (i440FX + PIIX, 1996) v: pc-i440fx-2.11 serial: N/A
           Mobo: N/A model: N/A serial: N/A BIOS: SeaBIOS v: rel-1.11.0-0-g63451fca13-prebuilt.qemu-project.org
           date: 04/01/2014
CPU:       Single Core: Virtual a7769a6388d5 type: MCP speed: 2394 MHz
Graphics:  Card-1: Cirrus Logic GD 5446 driver: cirrus v: kernel
           Display: server: No display server data found. Headless machine? tty: 202x24
           Message: Unable to show advanced data. Required tool glxinfo missing.
Network:   Card-1: Intel 82371AB/EB/MB PIIX4 ACPI type: network bridge driver: piix4_smbus
           Card-2: Red Hat Virtio network driver: virtio-pci
Drives:    Local Storage: total: 25.00 GiB used: 1.47 GiB (5.9%)
Info:      Processes: 64 Uptime: 5m Memory: 991.6 MiB used: 159.1 MiB (16.0%) Init: systemd runlevel: 3
           Shell: clstr_test.sh inxi: 3.0.20
CPU и ОЗУ
cat /proc/cpuinfo
-----------
processor : 0
vendor_id : GenuineIntel
cpu family  : 6
model   : 61
model name  : Virtual CPU a7769a6388d5
stepping  : 2
microcode : 0x1
cpu MHz   : 2394.454
cache size  : 16384 KB
physical id : 0
siblings  : 1
core id   : 0
cpu cores : 1
apicid    : 0
initial apicid  : 0
fpu   : yes
fpu_exception : yes
cpuid level : 13
wp    : yes
flags   : fpu vme de pse tsc msr pae mce cx8 apic sep mtrr pge mca cmov pat pse36 clflush mmx fxsr sse sse2 syscall nx rdtscp lm constant_tsc rep_good nopl xtopology eagerfpu pni pclmulqdq ssse3 fma cx16 pcid sse4_1 sse4_2 x2apic movbe popcnt tsc_deadline_timer aes xsave avx f16c rdrand hypervisor lahf_lm abm fsgsbase bmi1 avx2 smep bmi2 erms invpcid xsaveopt arat
bogomips  : 4788.90
clflush size  : 64
cache_alignment : 64
address sizes : 40 bits physical, 48 bits virtual
power management:


Memory Info:
====================================================
cat /proc/meminfo
-----------
MemTotal:        1015420 kB
MemFree:          239584 kB
MemAvailable:     754572 kB
Buffers:           34116 kB
Cached:           593848 kB
SwapCached:            0 kB
Active:           338916 kB
Inactive:         346092 kB
Active(anon):      57372 kB
Inactive(anon):    12752 kB
Active(file):     281544 kB
Inactive(file):   333340 kB
Unevictable:           0 kB
Mlocked:               0 kB
SwapTotal:             0 kB
SwapFree:              0 kB
Dirty:               388 kB
Writeback:             0 kB
AnonPages:         57056 kB
Mapped:            22064 kB
Shmem:             13112 kB
Slab:              67280 kB
SReclaimable:      55760 kB
SUnreclaim:        11520 kB
KernelStack:        1248 kB
PageTables:         3028 kB
NFS_Unstable:          0 kB
Bounce:                0 kB
WritebackTmp:          0 kB
CommitLimit:      507708 kB
Committed_AS:     191228 kB
VmallocTotal:   34359738367 kB
VmallocUsed:        8972 kB
VmallocChunk:   34359719676 kB
HardwareCorrupted:     0 kB
AnonHugePages:      6144 kB
CmaTotal:              0 kB
CmaFree:               0 kB
HugePages_Total:       0
HugePages_Free:        0
HugePages_Rsvd:        0
HugePages_Surp:        0
Hugepagesize:       2048 kB
DirectMap4k:       57200 kB
DirectMap2M:      991232 kB
Разметка диска
df -HT
-----------
Файловая система Тип      Размер Использовано  Дост Использовано% Cмонтировано в
/dev/vda1        ext4        27G         1,6G   24G            7% /
devtmpfs         devtmpfs   509M            0  509M            0% /dev
tmpfs            tmpfs      520M            0  520M            0% /dev/shm
tmpfs            tmpfs      520M          14M  507M            3% /run
tmpfs            tmpfs      520M            0  520M            0% /sys/fs/cgroup
tmpfs            tmpfs      104M            0  104M            0% /run/user/0
PT Summary
pt-summary
-----------
# Percona Toolkit System Summary Report ######################
        Date | 2018-08-23 09:55:31 UTC (local TZ: UTC +0000)
    Hostname | vultr.guest
      Uptime | 5 min,  1 user,  load average: 0,95, 0,86, 0,39
      System | QEMU; Standard PC (i440FX + PIIX, 1996); vpc-i440fx-2.11 (Other)
 Service Tag | Not Specified
    Platform | Linux
     Release | CentOS Linux release 7.5.1804 (Core)
      Kernel | 3.10.0-862.3.2.el7.x86_64
Architecture | CPU = 64-bit, OS = 64-bit
   Threading | NPTL 2.17
     SELinux | Disabled
 Virtualized | VMWare
# Processor ##################################################
  Processors | physical = 1, cores = 1, virtual = 1, hyperthreading = no
      Speeds | 1x2394.454
      Models | 1xVirtual CPU a7769a6388d5
      Caches | 1x16384 KB
# Memory #####################################################
       Total | 991,6M
        Free | 229,1M
        Used | physical = 80,0M, swap allocated = 0,0, swap used = 0,0, virtual = 80,0M
      Shared | 12,8M
     Buffers | 682,5M
      Caches | 735,2M
       Dirty | 492 kB
     UsedRSS | 112,0M
  Swappiness | 30
 DirtyPolicy | 30, 10
 DirtyStatus | 0, 0
  Locator   Size     Speed             Form Factor   Type          Type Detail
  ========= ======== ================= ============= ============= ===========
  DIMM 0    1024 MB  Unknown           DIMM          RAM           Other
# Mounted Filesystems ########################################
  Filesystem  Size Used Type     Opts                                             Mountpoint
  devtmpfs    486M   0% devtmpfs rw,nosuid,size=496928k,nr_inodes=124232,mode=755 /dev
  /dev/vda1    25G   7% ext4     rw,relatime,data=ordered                         /
  tmpfs       100M   0% tmpfs    rw,nosuid,nodev                                  /run/user/0
  tmpfs       100M   0% tmpfs    rw,nosuid,nodev,mode=755                         /run/user/0
  tmpfs       100M   0% tmpfs    rw,nosuid,nodev,relatime,size=101544k,mode=700   /run/user/0
  tmpfs       100M   0% tmpfs    ro,nosuid,nodev,noexec,mode=755                  /run/user/0
  tmpfs       496M   0% tmpfs    rw,nosuid,nodev                                  /dev/shm
  tmpfs       496M   0% tmpfs    rw,nosuid,nodev,mode=755                         /dev/shm
  tmpfs       496M   0% tmpfs    rw,nosuid,nodev,relatime,size=101544k,mode=700   /dev/shm
  tmpfs       496M   0% tmpfs    ro,nosuid,nodev,noexec,mode=755                  /dev/shm
  tmpfs       496M   0% tmpfs    rw,nosuid,nodev                                  /sys/fs/cgroup
  tmpfs       496M   0% tmpfs    rw,nosuid,nodev,mode=755                         /sys/fs/cgroup
  tmpfs       496M   0% tmpfs    rw,nosuid,nodev,relatime,size=101544k,mode=700   /sys/fs/cgroup
  tmpfs       496M   0% tmpfs    ro,nosuid,nodev,noexec,mode=755                  /sys/fs/cgroup
  tmpfs       496M   3% tmpfs    rw,nosuid,nodev                                  /run
  tmpfs       496M   3% tmpfs    rw,nosuid,nodev,mode=755                         /run
  tmpfs       496M   3% tmpfs    rw,nosuid,nodev,relatime,size=101544k,mode=700   /run
  tmpfs       496M   3% tmpfs    ro,nosuid,nodev,noexec,mode=755                  /run
# Disk Schedulers And Queue Size #############################
         sr0 | [deadline] 128
         vda | [mq-deadline] 256
# Disk Partioning ############################################
Device       Type      Start        End               Size
============ ==== ========== ========== ==================
/dev/vda     Disk                              26843545600
/dev/vda1    Part       2048   52428749        26842470912
# Kernel Inode State #########################################
dentry-state | 52925  43336 45  0 0 0
     file-nr | 768  0 98069
    inode-nr | 32290  7986
# LVM Volumes ################################################
Unable to collect information
# LVM Volume Groups ##########################################
Unable to collect information
# RAID Controller ############################################
  Controller | No RAID controller detected
# Network Config #############################################
  Controller | Red Hat, Inc. Virtio network device
 FIN Timeout | 60
  Port Range | 60999
# Interface Statistics #######################################
  interface  rx_bytes rx_packets  rx_errors   tx_bytes tx_packets  tx_errors
  ========= ========= ========== ========== ========== ========== ==========
  lo                0          0          0          0          0          0
  eth0      225000000      30000          0    2500000      20000          0
# Network Devices ############################################
  Device    Speed     Duplex
  ========= ========= =========
  eth0
# Top Processes ##############################################
  PID USER      PR  NI    VIRT    RES    SHR S %CPU %MEM     TIME+ COMMAND
 4859 root      20   0  161840   2028   1516 R  6,7  0,2   0:00.01 top
    1 root      20   0   43324   3520   2364 S  0,0  0,3   0:01.38 systemd
    2 root      20   0       0      0      0 S  0,0  0,0   0:00.00 kthreadd
    3 root      20   0       0      0      0 S  0,0  0,0   0:00.05 ksoftirqd/0
    4 root      20   0       0      0      0 S  0,0  0,0   0:00.25 kworker/0:0
    5 root       0 -20       0      0      0 S  0,0  0,0   0:00.00 kworker/0:0H
    6 root      20   0       0      0      0 S  0,0  0,0   0:00.17 kworker/u2:0
    7 root      rt   0       0      0      0 S  0,0  0,0   0:00.00 migration/0
    8 root      20   0       0      0      0 S  0,0  0,0   0:00.00 rcu_bh
# Notable Processes ##########################################
  PID    OOM    COMMAND
  674    -17    sshd
# Memory mamagement ##########################################
Transparent huge pages are enabled.
# The End ####################################################
Тесты
DD
dd if=/dev/zero of=test bs=64k count=16k conv=fdatasync 2>&1
rm -f test
-----------
16384+0 записей получено
16384+0 записей отправлено
 скопировано 1073741824 байта (1,1 GB), 3,26054 c, 329 MB/c
16384+0 записей получено
16384+0 записей отправлено
 скопировано 1073741824 байта (1,1 GB), 3,19559 c, 336 MB/c
16384+0 записей получено
16384+0 записей отправлено
 скопировано 1073741824 байта (1,1 GB), 3,07608 c, 349 MB/c
Sysbench тест CPU
sysbench cpu --cpu-max-prime=20000 --num-threads=1 run
-----------
sysbench 1.0.15 (using bundled LuaJIT 2.1.0-beta2)

Running the test with following options:
Number of threads: 1
Initializing random number generator from current time


Prime numbers limit: 20000

Initializing worker threads...

Threads started!

CPU speed:
    events per second:   290.21

General statistics:
    total time:                          10.0038s
    total number of events:              2904

Latency (ms):
         min:                                    3.08
         avg:                                    3.44
         max:                                   17.75
         95th percentile:                        3.96
         sum:                                 9991.50

Threads fairness:
    events (avg/stddev):           2904.0000/0.00
    execution time (avg/stddev):   9.9915/0.00
sysbench mutex --threads=64 run
-----------
sysbench 1.0.15 (using bundled LuaJIT 2.1.0-beta2)

Running the test with following options:
Number of threads: 64
Initializing random number generator from current time


Initializing worker threads...

Threads started!


General statistics:
    total time:                          14.9168s
    total number of events:              64

Latency (ms):
         min:                                13746.86
         avg:                                14343.90
         max:                                14844.39
         95th percentile:                    14827.42
         sum:                               918009.75

Threads fairness:
    events (avg/stddev):           1.0000/0.00
    execution time (avg/stddev):   14.3439/0.30
Sysbench тест ОЗУ
sysbench memory --num-threads=4 --memory-total-size=1G run
-----------
WARNING: --num-threads is deprecated, use --threads instead
sysbench 1.0.15 (using bundled LuaJIT 2.1.0-beta2)

Running the test with following options:
Number of threads: 4
Initializing random number generator from current time


Running memory speed test with the following options:
  block size: 1KiB
  total size: 1024MiB
  operation: write
  scope: global

Initializing worker threads...

Threads started!

Total operations: 1048576 (2840652.32 per second)

1024.00 MiB transferred (2774.07 MiB/sec)


General statistics:
    total time:                          0.3665s
    total number of events:              1048576

Latency (ms):
         min:                                    0.00
         avg:                                    0.00
         max:                                   33.06
         95th percentile:                        0.00
         sum:                                  389.90

Threads fairness:
    events (avg/stddev):           262144.0000/0.00
    execution time (avg/stddev):   0.0975/0.03
Sysbench тест диска
sysbench fileio --file-total-size=2G prepare
-----------
sysbench 1.0.15 (using bundled LuaJIT 2.1.0-beta2)

128 files, 16384Kb each, 2048Mb total
Creating files for the test...
Extra file open flags: (none)
Creating file test_file.0
...
Creating file test_file.127
2147483648 bytes written in 10.08 seconds (203.24 MiB/sec).

sysbench fileio --file-total-size=2G --file-test-mode=rndrw --time=300 --max-requests=0 run
-----------
sysbench 1.0.15 (using bundled LuaJIT 2.1.0-beta2)

Running the test with following options:
Number of threads: 1
Initializing random number generator from current time


Extra file open flags: (none)
128 files, 16MiB each
2GiB total file size
Block size 16KiB
Number of IO requests: 0
Read/Write ratio for combined random IO test: 1.50
Periodic FSYNC enabled, calling fsync() each 100 requests.
Calling fsync() at the end of test, Enabled.
Using synchronous I/O mode
Doing random r/w test
Initializing worker threads...

Threads started!


File operations:
    reads/s:                      948.79
    writes/s:                     632.52
    fsyncs/s:                     2024.10

Throughput:
    read, MiB/s:                  14.82
    written, MiB/s:               9.88

General statistics:
    total time:                          300.0566s
    total number of events:              1081725

Latency (ms):
         min:                                    0.00
         avg:                                    0.28
         max:                                   36.75
         95th percentile:                        1.16
         sum:                               298172.40

Threads fairness:
    events (avg/stddev):           1081725.0000/0.00
    execution time (avg/stddev):   298.1724/0.00
SpeedTest
Такое ощущение что speedtest обращался к серверу который находится в той же подсети =) Скорости запредельные.
speedtest-cli
-----------
Retrieving speedtest.net configuration...
Testing from Choopa, LLC (199.247.21.57)...
Retrieving speedtest.net server list...
Selecting best server based on ping...
Hosted by Interoute VDC (Frankfurt) [2.15 km]: 2.287 ms
Testing download speed................................................................................
Download: 2385.68 Mbit/s
Testing upload speed....................................................................................................
Upload: 473.58 Mbit/s
7-zip benchmark
7-Zip (a) [64] 16.02 : Copyright (c) 1999-2016 Igor Pavlov : 2016-05-21
p7zip Version 16.02 (locale=ru_RU.UTF-8,Utf16=on,HugeFiles=on,64 bits,1 CPU Virtual CPU a7769a6388d5 (306D2),ASM,AES-NI)

Virtual CPU a7769a6388d5 (306D2)
CPU Freq:  2333  2302  2328  2306  2301  2336  2194  2500  2503

RAM size:     991 MB,  # CPU hardware threads:   1
RAM usage:    435 MB,  # Benchmark threads:      1

                       Compressing  |                  Decompressing
Dict     Speed Usage    R/U Rating  |      Speed Usage    R/U Rating
         KiB/s     %   MIPS   MIPS  |      KiB/s     %   MIPS   MIPS

22:       2197    99   2153   2137  |      25865   100   2215   2208
23:       1933    99   1984   1970  |      24797    99   2161   2146
24:       1839   100   1985   1978  |      25131    98   2250   2206
25:       1685    99   1936   1925  |      23557    99   2107   2097
----------------------------------  | ------------------------------
Avr:              99   2014   2002  |               99   2183   2164
Tot:              99   2099   2083
Выводы
Добротный сервер за адекватные деньги.
UPD 2021:
Это промокод который дает 100$ на ваш аккаунт на 14 дней. Думаю этого хватит чтобы протестировать услуги хостинга 😋
