![]()
Добрый день!
Затестил тут 2 тарифа виртуалок на хостинге Бегет. В данном посте публикую результаты теста виртуалки на самом дешевом тарифе с 1Gb ОЗУ, 1 ядром процессора и 15Gb SSD.
Стоимость такого конфига 11 рублей в сутки или 330 рублей в месяц.
Панель управления
В целом у Бегета довольно удобная самописная панель управления.
Начнем со страницы выбора тарифа и создания VM.
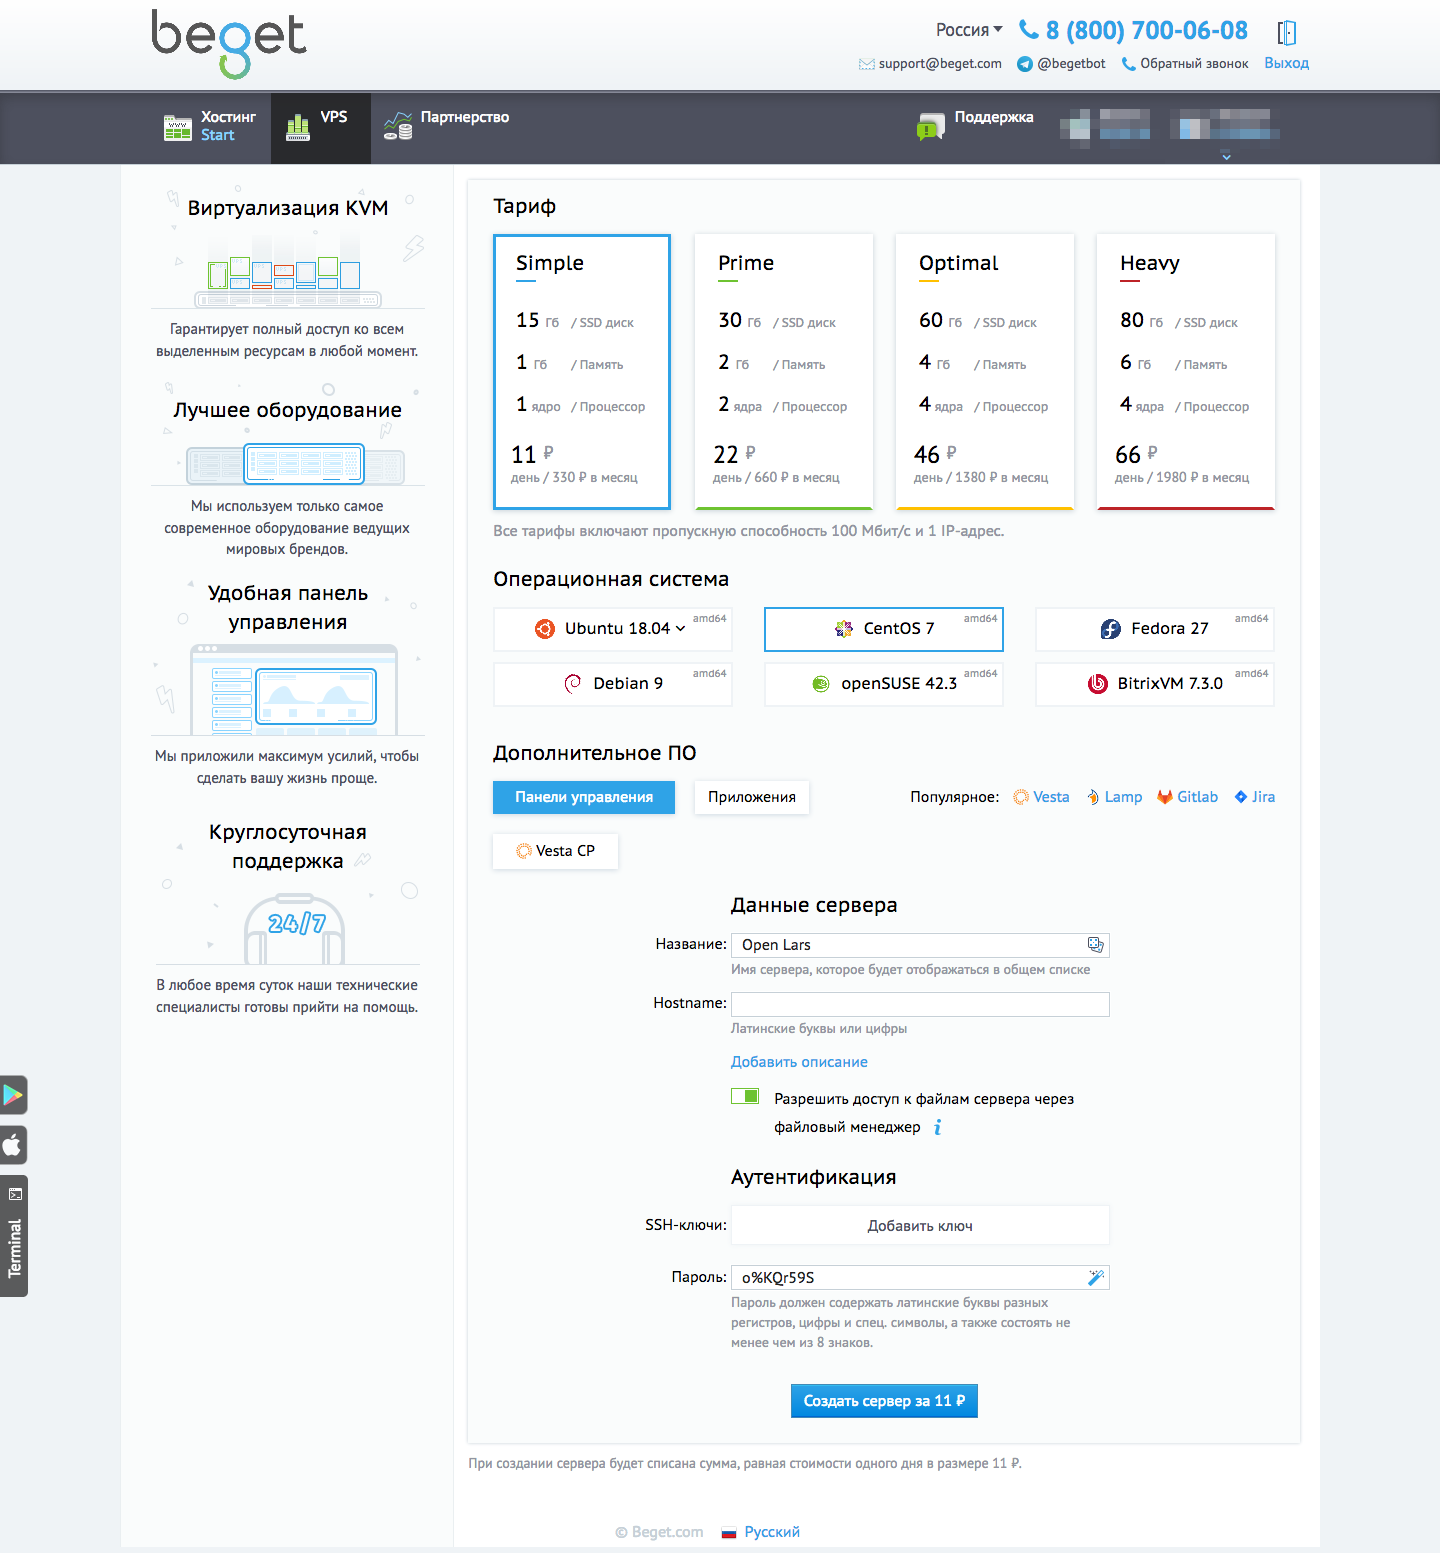
Вариантов выбора ОС немного, но присутствуют все популярные и также есть уже готовые образы с приложениями (Gitlab, Vesta, etc)
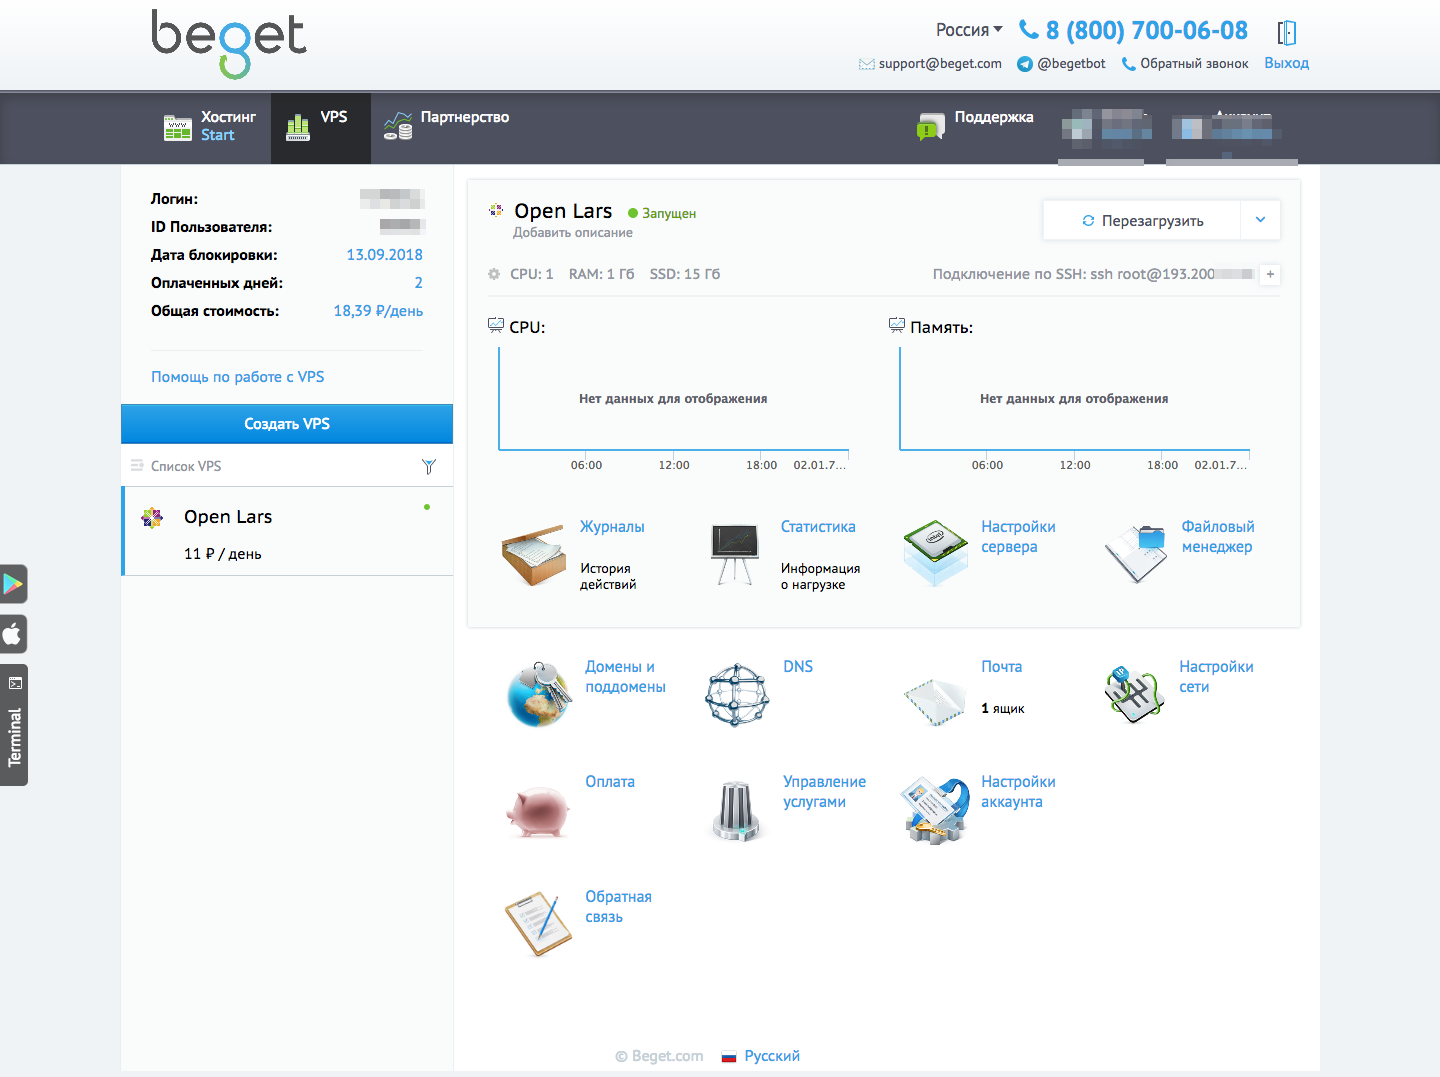
Вот страница управления запущенным сервером.
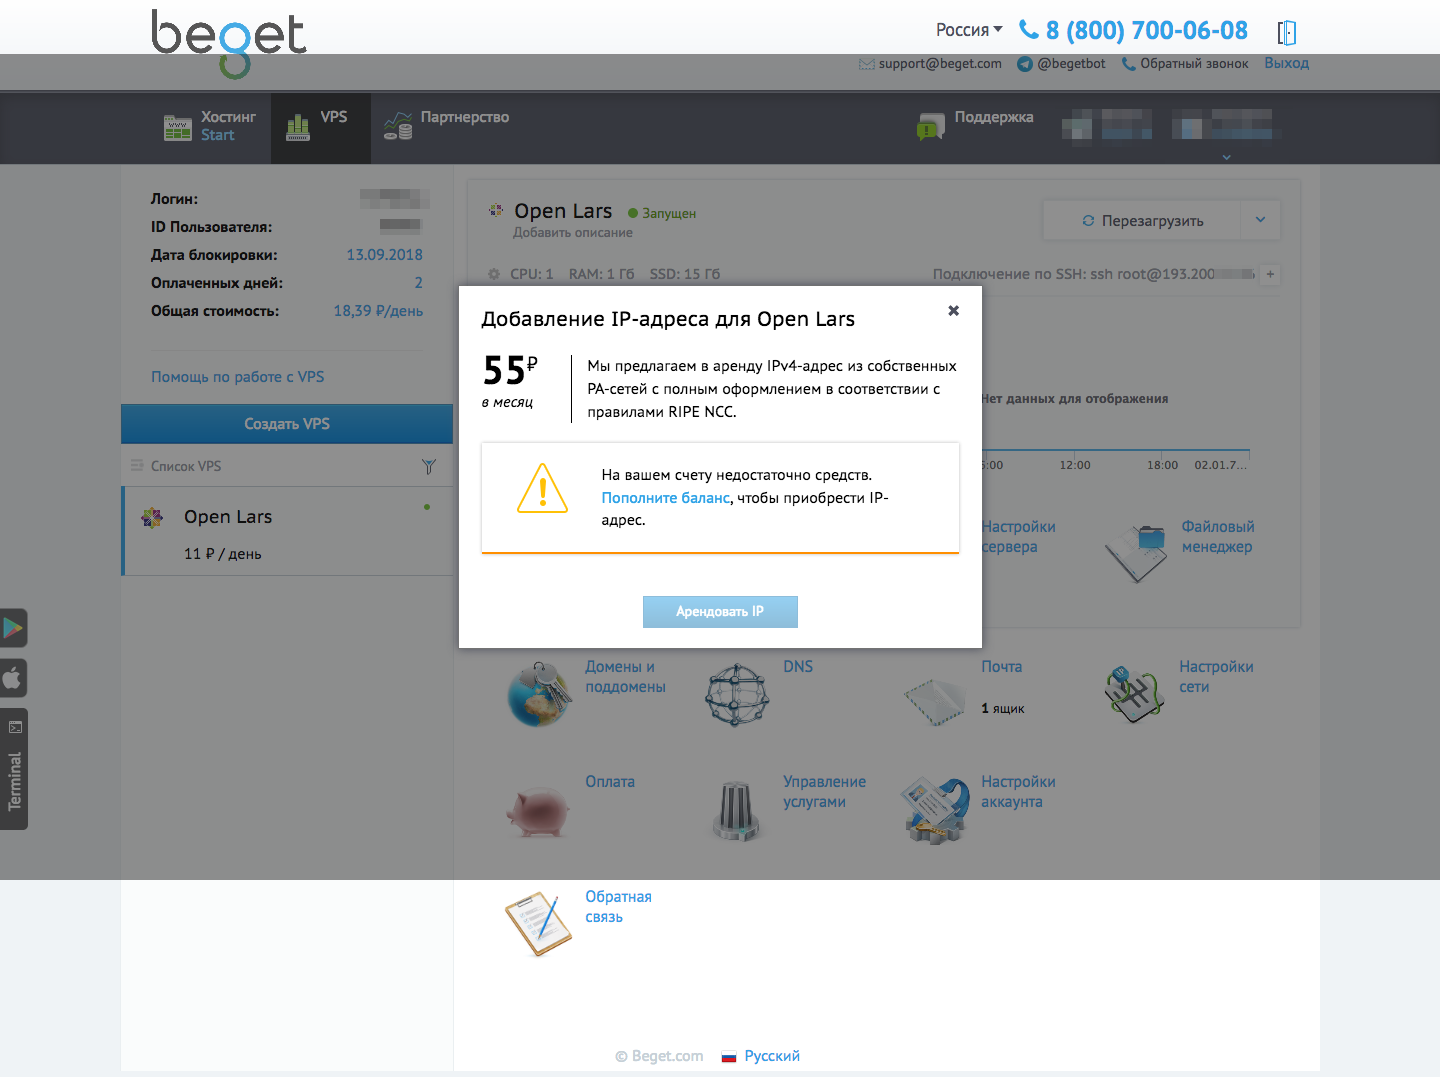
Покупка дополнительного Ipv4 за 55 рублей в месяц.
Статистика по нагрузкам на VM
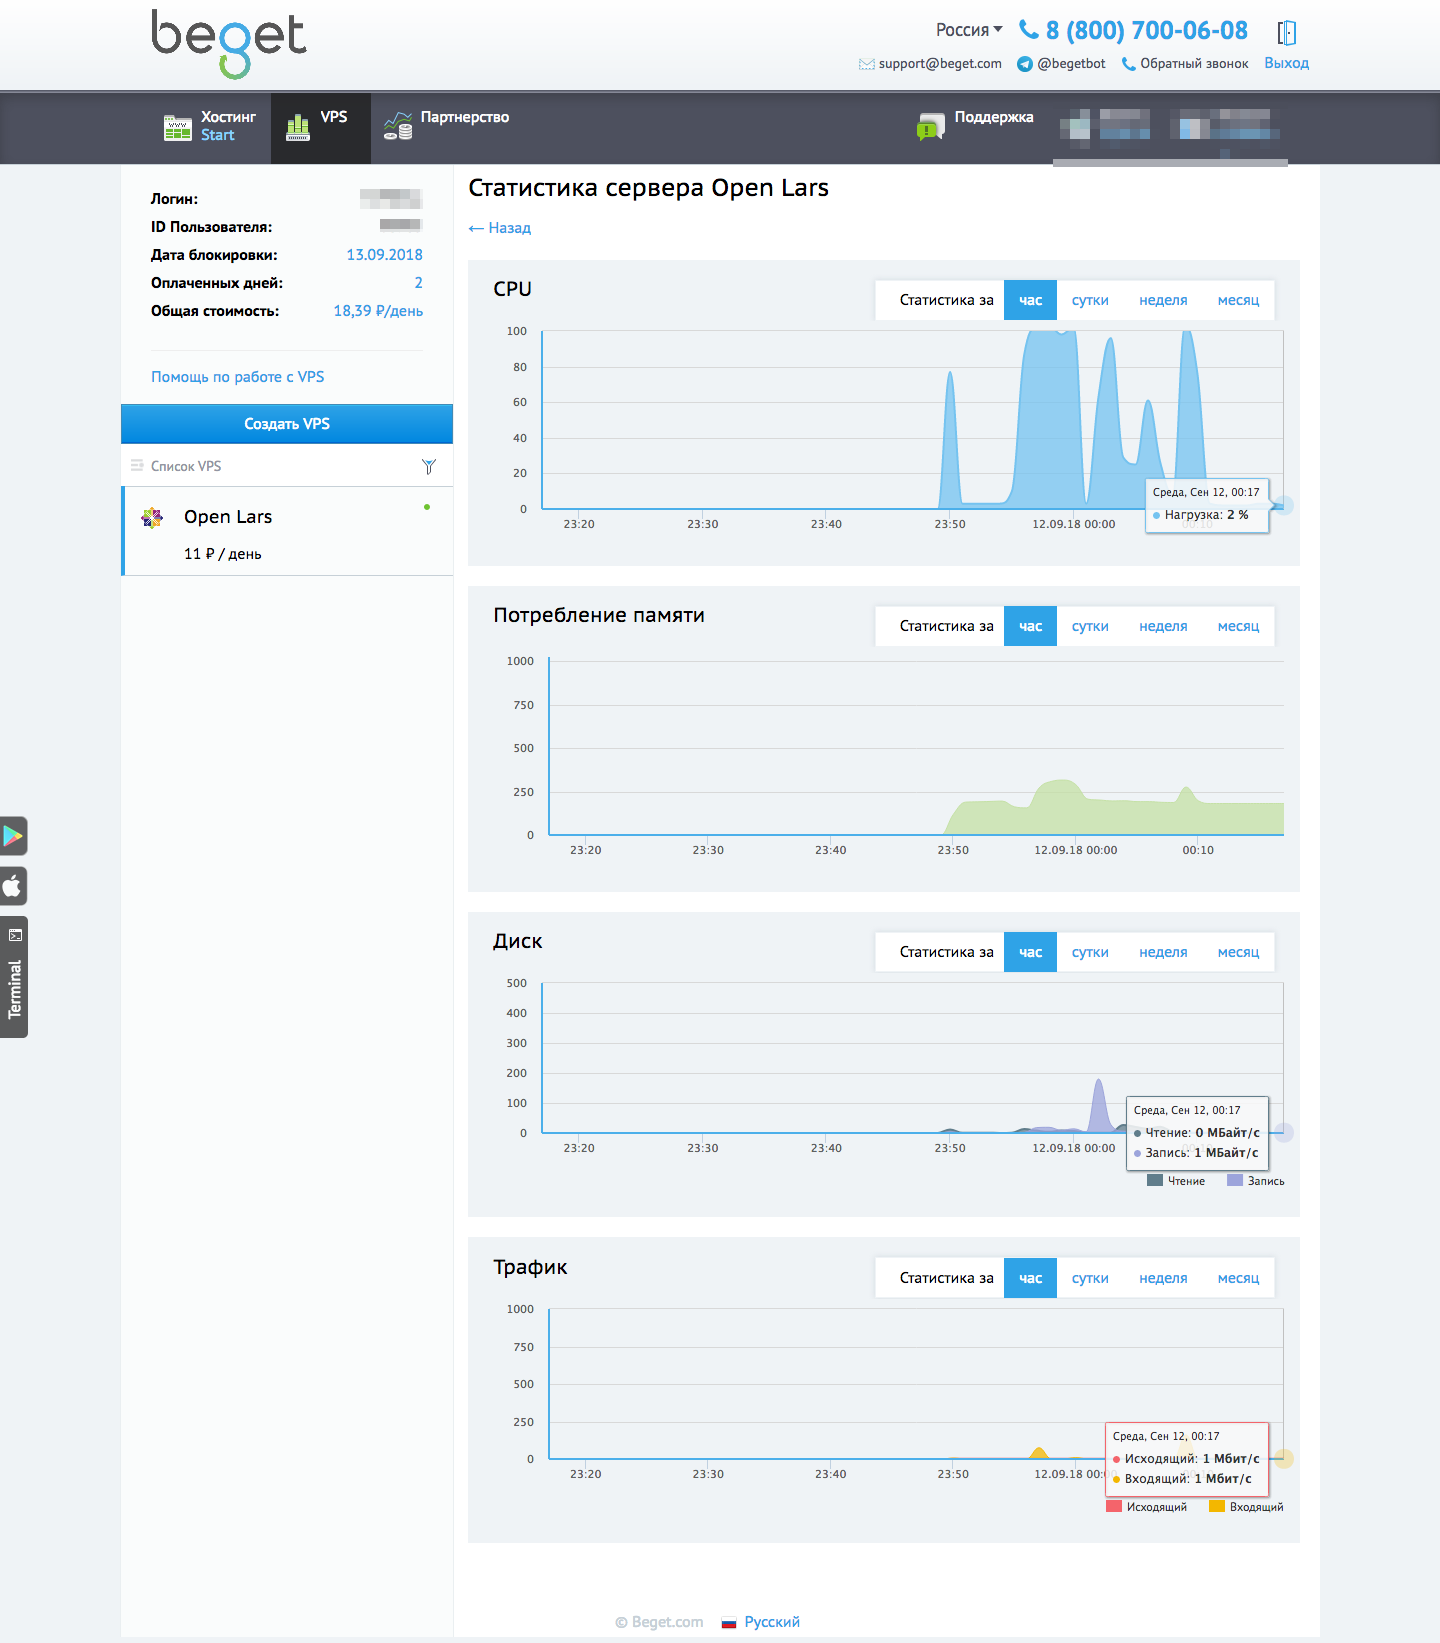
Ну а теперь вернемся к тестам:
Сведения о VM
CentOS Linux release 7.5.1804 (Core)
cat /etc/centos-release
-----------
CentOS Linux release 7.5.1804 (Core)
uname -a
-----------
Linux test 3.10.0-862.6.3.el7.x86_64 #1 SMP Tue Jun 26 16:32:21 UTC 2018 x86_64 x86_64 x86_64 GNU/Linux
Виртуализация KVM
inxi -b
-----------
System:    Host: test Kernel: 3.10.0-862.6.3.el7.x86_64 x86_64 bits: 64 Console: N/A
           Distro: CentOS Linux release 7.5.1804 (Core)
Machine:   Type: Kvm System: QEMU product: Standard PC (i440FX + PIIX, 1996) v: pc-i440fx-2.11 serial: N/A
           Mobo: N/A model: N/A serial: N/A BIOS: SeaBIOS v: 1.10.2-1ubuntu1 date: 04/01/2014
CPU:       Single Core: Intel Xeon E5-2699 v4 type: MCP speed: 2200 MHz
Graphics:  Card-1: Cirrus Logic GD 5446 driver: cirrus v: kernel
           Display: server: No display server data found. Headless machine? tty: 204x25
           Message: Unable to show advanced data. Required tool glxinfo missing.
Network:   Card-1: Intel 82371AB/EB/MB PIIX4 ACPI type: network bridge driver: piix4_smbus
           Card-2: Red Hat Virtio network driver: virtio-pci
Drives:    Local Storage: total: 15.00 GiB used: 1.78 GiB (11.8%)
Info:      Processes: 81 Uptime: 6m Memory: 926.2 MiB used: 221.1 MiB (23.9%) Init: systemd runlevel: 3
           Shell: clstr_test.sh inxi: 3.0.20
CPU и ОЗУ
CPU Info:
====================================================
cat /proc/cpuinfo
-----------
processor	: 0
vendor_id	: GenuineIntel
cpu family	: 6
model		: 79
model name	: Intel(R) Xeon(R) CPU E5-2699 v4 @ 2.20GHz
stepping	: 1
microcode	: 0x1
cpu MHz		: 2199.994
cache size	: 16384 KB
physical id	: 0
siblings	: 1
core id		: 0
cpu cores	: 1
apicid		: 0
initial apicid	: 0
fpu		: yes
fpu_exception	: yes
cpuid level	: 13
wp		: yes
flags		: fpu vme de pse tsc msr pae mce cx8 apic sep mtrr pge mca cmov pat pse36 clflush mmx fxsr sse sse2 ss syscall nx pdpe1gb rdtscp lm constant_tsc arch_perfmon rep_good nopl xtopology eagerfpu pni pclmulqdq ssse3 fma cx16 pcid sse4_1 sse4_2 x2apic movbe popcnt tsc_deadline_timer aes xsave avx f16c rdrand hypervisor lahf_lm abm 3dnowprefetch ibrs ibpb fsgsbase tsc_adjust bmi1 hle avx2 smep bmi2 erms invpcid rtm rdseed adx smap xsaveopt arat spec_ctrl
bogomips	: 4399.98
clflush size	: 64
cache_alignment	: 64
address sizes	: 40 bits physical, 48 bits virtual
power management:


Memory Info:
====================================================
cat /proc/meminfo
-----------
MemTotal:         948464 kB
MemFree:          160120 kB
MemAvailable:     620424 kB
Buffers:           26120 kB
Cached:           550780 kB
SwapCached:            0 kB
Active:           392056 kB
Inactive:         305380 kB
Active(anon):     121024 kB
Inactive(anon):    11964 kB
Active(file):     271032 kB
Inactive(file):   293416 kB
Unevictable:           0 kB
Mlocked:               0 kB
SwapTotal:             0 kB
SwapFree:              0 kB
Dirty:               128 kB
Writeback:             0 kB
AnonPages:        120560 kB
Mapped:            56196 kB
Shmem:             12452 kB
Slab:              63740 kB
SReclaimable:      46740 kB
SUnreclaim:        17000 kB
KernelStack:        2240 kB
PageTables:         4764 kB
NFS_Unstable:          0 kB
Bounce:                0 kB
WritebackTmp:          0 kB
CommitLimit:      474232 kB
Committed_AS:     480752 kB
VmallocTotal:   34359738367 kB
VmallocUsed:        9312 kB
VmallocChunk:   34359719676 kB
HardwareCorrupted:     0 kB
AnonHugePages:     16384 kB
CmaTotal:              0 kB
CmaFree:               0 kB
HugePages_Total:       0
HugePages_Free:        0
HugePages_Rsvd:        0
HugePages_Surp:        0
Hugepagesize:       2048 kB
DirectMap4k:       59248 kB
DirectMap2M:      989184 kB
DirectMap1G:           0 kB
Разметка диска
df -HT
-----------
Filesystem     Type      Size  Used Avail Use% Mounted on
/dev/sda1      ext4       16G  2.0G   14G  13% /
devtmpfs       devtmpfs  463M     0  463M   0% /dev
tmpfs          tmpfs     486M     0  486M   0% /dev/shm
tmpfs          tmpfs     486M   13M  473M   3% /run
tmpfs          tmpfs     486M     0  486M   0% /sys/fs/cgroup
tmpfs          tmpfs      98M     0   98M   0% /run/user/0
PT Summary
pt-summary
-----------
# Percona Toolkit System Summary Report ######################
        Date | 2018-09-11 20:02:36 UTC (local TZ: UTC +0000)
    Hostname | test
      Uptime | 6 min,  1 user,  load average: 0.36, 0.74, 0.37
      System | QEMU; Standard PC (i440FX + PIIX, 1996); vpc-i440fx-2.11 (Other)
 Service Tag | Not Specified
    Platform | Linux
     Release | CentOS Linux release 7.5.1804 (Core)
      Kernel | 3.10.0-862.6.3.el7.x86_64
Architecture | CPU = 64-bit, OS = 64-bit
   Threading | NPTL 2.17
     SELinux | Disabled
 Virtualized | VMWare
# Processor ##################################################
  Processors | physical = 1, cores = 1, virtual = 1, hyperthreading = no
      Speeds | 1x2199.994
      Models | 1xIntel(R) Xeon(R) CPU E5-2699 v4 @ 2.20GHz
      Caches | 1x16384 KB
# Memory #####################################################
       Total | 926.2M
        Free | 151.1M
        Used | physical = 145.5M, swap allocated = 0.0, swap used = 0.0, virtual = 145.5M
      Shared | 12.2M
     Buffers | 629.7M
      Caches | 604.2M
       Dirty | 120 kB
     UsedRSS | 217.7M
  Swappiness | 30
 DirtyPolicy | 30, 10
 DirtyStatus | 0, 0
  Locator   Size     Speed             Form Factor   Type          Type Detail
  ========= ======== ================= ============= ============= ===========
  DIMM 0    1024 MB  Unknown           DIMM          RAM           Other
# Mounted Filesystems ########################################
  Filesystem  Size Used Type     Opts                                             Mountpoint
  /dev/sda1    15G  13% ext4     rw,relatime,data=ordered                         /
  devtmpfs    442M   0% devtmpfs rw,nosuid,size=451588k,nr_inodes=112897,mode=755 /dev
  tmpfs       464M   0% tmpfs    rw,nosuid,nodev                                  /dev/shm
  tmpfs       464M   0% tmpfs    rw,nosuid,nodev,mode=755                         /dev/shm
  tmpfs       464M   0% tmpfs    rw,nosuid,nodev,relatime,size=94848k,mode=700    /dev/shm
  tmpfs       464M   0% tmpfs    ro,nosuid,nodev,noexec,mode=755                  /dev/shm
  tmpfs       464M   0% tmpfs    rw,nosuid,nodev                                  /sys/fs/cgroup
  tmpfs       464M   0% tmpfs    rw,nosuid,nodev,mode=755                         /sys/fs/cgroup
  tmpfs       464M   0% tmpfs    rw,nosuid,nodev,relatime,size=94848k,mode=700    /sys/fs/cgroup
  tmpfs       464M   0% tmpfs    ro,nosuid,nodev,noexec,mode=755                  /sys/fs/cgroup
  tmpfs       464M   3% tmpfs    rw,nosuid,nodev                                  /run
  tmpfs       464M   3% tmpfs    rw,nosuid,nodev,mode=755                         /run
  tmpfs       464M   3% tmpfs    rw,nosuid,nodev,relatime,size=94848k,mode=700    /run
  tmpfs       464M   3% tmpfs    ro,nosuid,nodev,noexec,mode=755                  /run
  tmpfs        93M   0% tmpfs    rw,nosuid,nodev                                  /run/user/0
  tmpfs        93M   0% tmpfs    rw,nosuid,nodev,mode=755                         /run/user/0
  tmpfs        93M   0% tmpfs    rw,nosuid,nodev,relatime,size=94848k,mode=700    /run/user/0
  tmpfs        93M   0% tmpfs    ro,nosuid,nodev,noexec,mode=755                  /run/user/0
# Disk Schedulers And Queue Size #############################
         sda | [deadline] 128
         sr0 | [deadline] 128
# Disk Partioning ############################################
Device       Type      Start        End               Size
============ ==== ========== ========== ==================
/dev/sda     Disk                              16106127360
/dev/sda1    Part       2048   31457246        16105061376
/dev/sr0     Disk                                   378880
# Kernel Inode State #########################################
dentry-state | 47273	32880	45	0	0	0
     file-nr | 1216	0	88949
    inode-nr | 33394	11575
# LVM Volumes ################################################
Unable to collect information
# LVM Volume Groups ##########################################
Unable to collect information
# RAID Controller ############################################
  Controller | No RAID controller detected
# Network Config #############################################
  Controller | Red Hat, Inc. Virtio network device
 FIN Timeout | 60
  Port Range | 60999
# Interface Statistics #######################################
  interface  rx_bytes rx_packets  rx_errors   tx_bytes tx_packets  tx_errors
  ========= ========= ========== ========== ========== ========== ==========
  lo              400          6          0        400          6          0
  eth0      175000000      60000          0    2000000      20000          0
  docker0           0          0          0          0          0          0
# Network Devices ############################################
  Device    Speed     Duplex
  ========= ========= =========
  eth0
  docker0
# Network Connections ########################################
  Connections from remote IP addresses
    5.101.159.144       1
    176.116.139.37      1
  Connections to local IP addresses
    193.200.74.26       2
  Connections to top 10 local ports
    22                  1
    36758               1
  States of connections
    ESTABLISHED         2
    LISTEN              6
# Top Processes ##############################################
  PID USER      PR  NI    VIRT    RES    SHR S %CPU %MEM     TIME+ COMMAND
    1 root      20   0   43488   3692   2404 S  0.0  0.4   0:02.88 systemd
    2 root      20   0       0      0      0 S  0.0  0.0   0:00.00 kthreadd
    3 root      20   0       0      0      0 S  0.0  0.0   0:00.07 ksoftirqd/0
    5 root       0 -20       0      0      0 S  0.0  0.0   0:00.00 kworker/0:0H
    7 root      rt   0       0      0      0 S  0.0  0.0   0:00.00 migration/0
    8 root      20   0       0      0      0 S  0.0  0.0   0:00.00 rcu_bh
    9 root      20   0       0      0      0 S  0.0  0.0   0:00.41 rcu_sched
   10 root       0 -20       0      0      0 S  0.0  0.0   0:00.00 lru-add-dra+
   11 root      rt   0       0      0      0 S  0.0  0.0   0:00.00 watchdog/0
# Notable Processes ##########################################
  PID    OOM    COMMAND
 1275    -17    sshd
# Memory mamagement ##########################################
Transparent huge pages are enabled.
# The End ####################################################
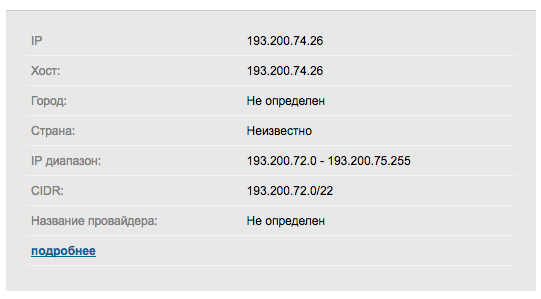
IP
2ip кстати не определил принадлежность IP к какой-либо геолокации.
Тесты
DD
dd if=/dev/zero of=test bs=64k count=16k conv=fdatasync 2>&1
rm -f test
-----------
16384+0 records in
16384+0 records out
1073741824 bytes (1.1 GB) copied, 3.645 s, 295 MB/s
16384+0 records in
16384+0 records out
1073741824 bytes (1.1 GB) copied, 5.36389 s, 200 MB/s
16384+0 records in
16384+0 records out
1073741824 bytes (1.1 GB) copied, 5.38582 s, 199 MB/s
Sysbench тест CPU
sysbench cpu --cpu-max-prime=20000 --num-threads=1 run ----------- sysbench 1.0.15 (using bundled LuaJIT 2.1.0-beta2) Running the test with following options: Number of threads: 1 Initializing random number generator from current time Prime numbers limit: 20000 Initializing worker threads... Threads started! CPU speed: events per second: 342.67 General statistics: total time: 10.0006s total number of events: 3428 Latency (ms): min: 2.69 avg: 2.92 max: 12.51 95th percentile: 3.07 sum: 9995.12 Threads fairness: events (avg/stddev): 3428.0000/0.00 execution time (avg/stddev): 9.9951/0.00
sysbench mutex --threads=64 run
-----------
sysbench 1.0.15 (using bundled LuaJIT 2.1.0-beta2)

Running the test with following options:
Number of threads: 64
Initializing random number generator from current time


Initializing worker threads...

Threads started!


General statistics:
    total time:                          12.2739s
    total number of events:              64

Latency (ms):
         min:                                11345.40
         avg:                                11782.58
         max:                                12227.72
         95th percentile:                    12163.09
         sum:                               754085.39

Threads fairness:
    events (avg/stddev):           1.0000/0.00
    execution time (avg/stddev):   11.7826/0.19
Sysbench тест ОЗУ
sysbench memory --num-threads=4 --memory-total-size=512M run
-----------
WARNING: --num-threads is deprecated, use --threads instead
sysbench 1.0.15 (using bundled LuaJIT 2.1.0-beta2)

Running the test with following options:
Number of threads: 4
Initializing random number generator from current time


Running memory speed test with the following options:
  block size: 1KiB
  total size: 512MiB
  operation: write
  scope: global

Initializing worker threads...

Threads started!

Total operations: 524288 (3828623.08 per second)

512.00 MiB transferred (3738.89 MiB/sec)


General statistics:
    total time:                          0.1347s
    total number of events:              524288

Latency (ms):
         min:                                    0.00
         avg:                                    0.00
         max:                                   28.02
         95th percentile:                        0.00
         sum:                                  188.02

Threads fairness:
    events (avg/stddev):           131072.0000/0.00
    execution time (avg/stddev):   0.0470/0.01
Sysbench тест диска
sysbench fileio --file-total-size=1G prepare
-----------
sysbench 1.0.15 (using bundled LuaJIT 2.1.0-beta2)

128 files, 8192Kb each, 1024Mb total
Creating files for the test...
Extra file open flags: (none)
Creating file test_file.0
...
Creating file test_file.127
1073741824 bytes written in 42.21 seconds (24.26 MiB/sec).
sysbench fileio --file-total-size=1G --file-test-mode=rndrw --time=300 --max-requests=0 run
-----------
sysbench 1.0.15 (using bundled LuaJIT 2.1.0-beta2)

Running the test with following options:
Number of threads: 1
Initializing random number generator from current time


Extra file open flags: (none)
128 files, 8MiB each
1GiB total file size
Block size 16KiB
Number of IO requests: 0
Read/Write ratio for combined random IO test: 1.50
Periodic FSYNC enabled, calling fsync() each 100 requests.
Calling fsync() at the end of test, Enabled.
Using synchronous I/O mode
Doing random r/w test
Initializing worker threads...

Threads started!


File operations:
    reads/s:                      236.59
    writes/s:                     157.72
    fsyncs/s:                     504.84

Throughput:
    read, MiB/s:                  3.70
    written, MiB/s:               2.46

General statistics:
    total time:                          300.7769s
    total number of events:              270316

Latency (ms):
         min:                                    0.00
         avg:                                    1.11
         max:                                  655.58
         95th percentile:                        0.74
         sum:                               299758.94

Threads fairness:
    events (avg/stddev):           270316.0000/0.00
    execution time (avg/stddev):   299.7589/0.00
SpeedTest
speedtest-cli
-----------
Retrieving speedtest.net configuration...
Testing from Beget LLC (193.200.74.26)...
Retrieving speedtest.net server list...
Selecting best server based on ping...
Hosted by Akado Telecom (Moscow) [1.61 km]: 14.661 ms
Testing download speed................................................................................
Download: 219.97 Mbit/s
Testing upload speed....................................................................................................
Upload: 305.77 Mbit/s
7-zip benchmark
7-Zip (a) [64] 16.02 : Copyright (c) 1999-2016 Igor Pavlov : 2016-05-21
p7zip Version 16.02 (locale=en_US.UTF-8,Utf16=on,HugeFiles=on,64 bits,1 CPU Intel(R) Xeon(R) CPU E5-2699 v4 @ 2.20GHz (406F1),ASM,AES-NI)

Intel(R) Xeon(R) CPU E5-2699 v4 @ 2.20GHz (406F1)
CPU Freq:  2661  2727  2627  2660  2704  2698  2679  2720  2705

RAM size:     926 MB,  # CPU hardware threads:   1
RAM usage:    435 MB,  # Benchmark threads:      1

                       Compressing  |                  Decompressing
Dict     Speed Usage    R/U Rating  |      Speed Usage    R/U Rating
         KiB/s     %   MIPS   MIPS  |      KiB/s     %   MIPS   MIPS

22:       3140   100   3066   3055  |      32177    99   2768   2747
23:       2861    99   2931   2916  |      31792   100   2763   2752
24:       2558    99   2768   2750  |      31669   100   2785   2780
25:       2500   100   2866   2855  |      30392    99   2731   2705
----------------------------------  | ------------------------------
Avr:             100   2908   2894  |               99   2762   2746
Tot:              99   2835   2820
1C-Битрикс
Также развернул Битрикс без каких-либо особенных настроек сервера. Попугаев много не показало =)
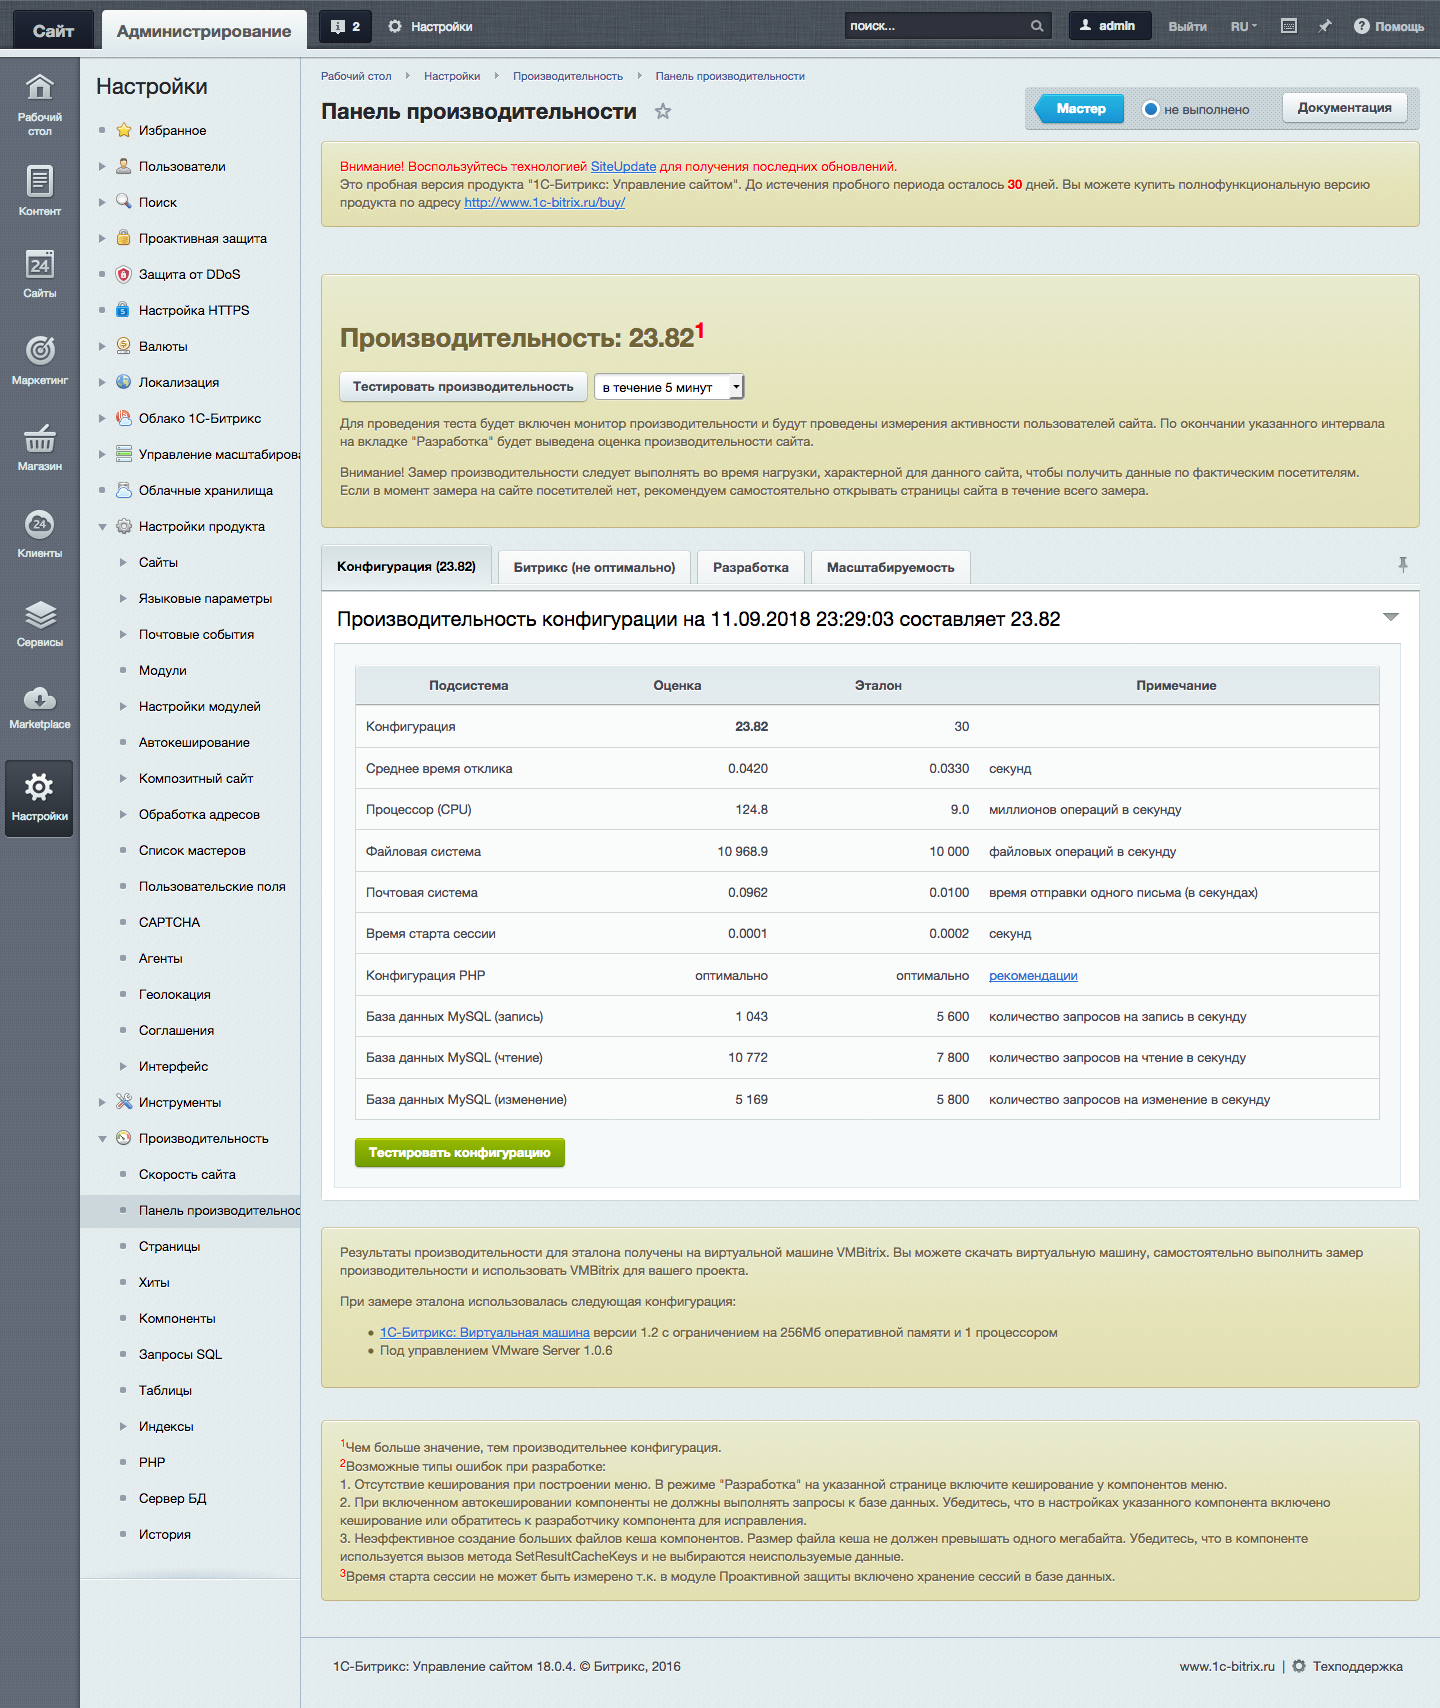
Выводы
Неплохая VPS за свои деньги. Чем то особенным не выделяется. Каких-то косяков тоже не замечено.