![]()
Добрый день!
На днях прилетело письмо от Scaleway с новостями об обновлении линейки серверов. Кратко - запилили новые develop-сервера на AMD Epyc, добавили тарифы с Nvidia Tesla и вовсю пиарят свой S3-совместимый сторадж. В честь этого обновления любезно предоставили 100 евро на тестирование всем новым пользователям до 1 мая.
Также у них остались доступными для заказа старые сервера на ARM и x86. Вообще у них довольно низкие цены и возможность приобрести выделенный сервер по цене виртуалки.
Правда стоит всегда помнить о регулярном резервном копировании ваших данных.
Помню как-то пару лет назад у меня однажды отвалилась виртуальная машина в Scaleway и больше не смогла стартовать. Техподдержка ответила что это был какой-то сбой в их платформе и что мол подняли вам новую чистую виртуалку. Поинтересовался о компенсации - ответили что никаких гарантий сохранения данных на инстансах они не предоставляют. Предполагается что машинки создаются/удаляются автоматически, софт на них развертыывается автоматически и потерять в процессе один инстанс не страшно.
Ну да ладно, переидем к тестам:
Панель услуг
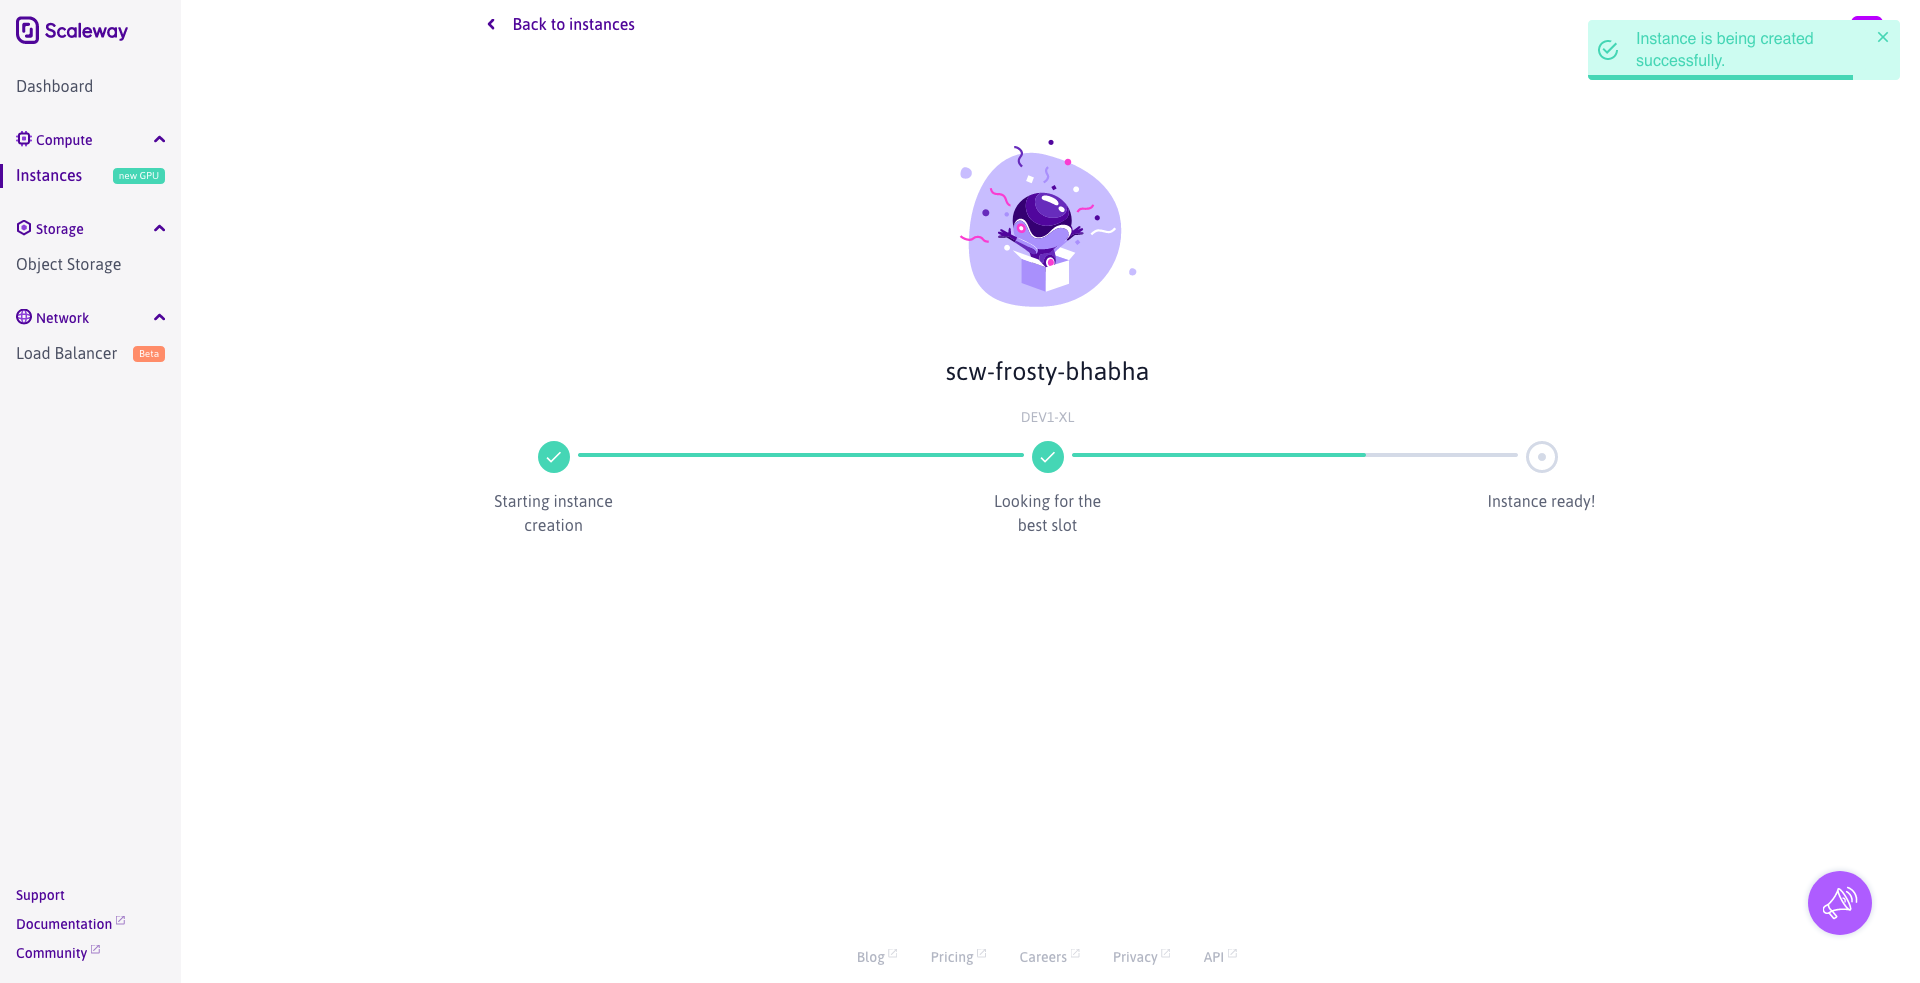
Создание нового инстансы

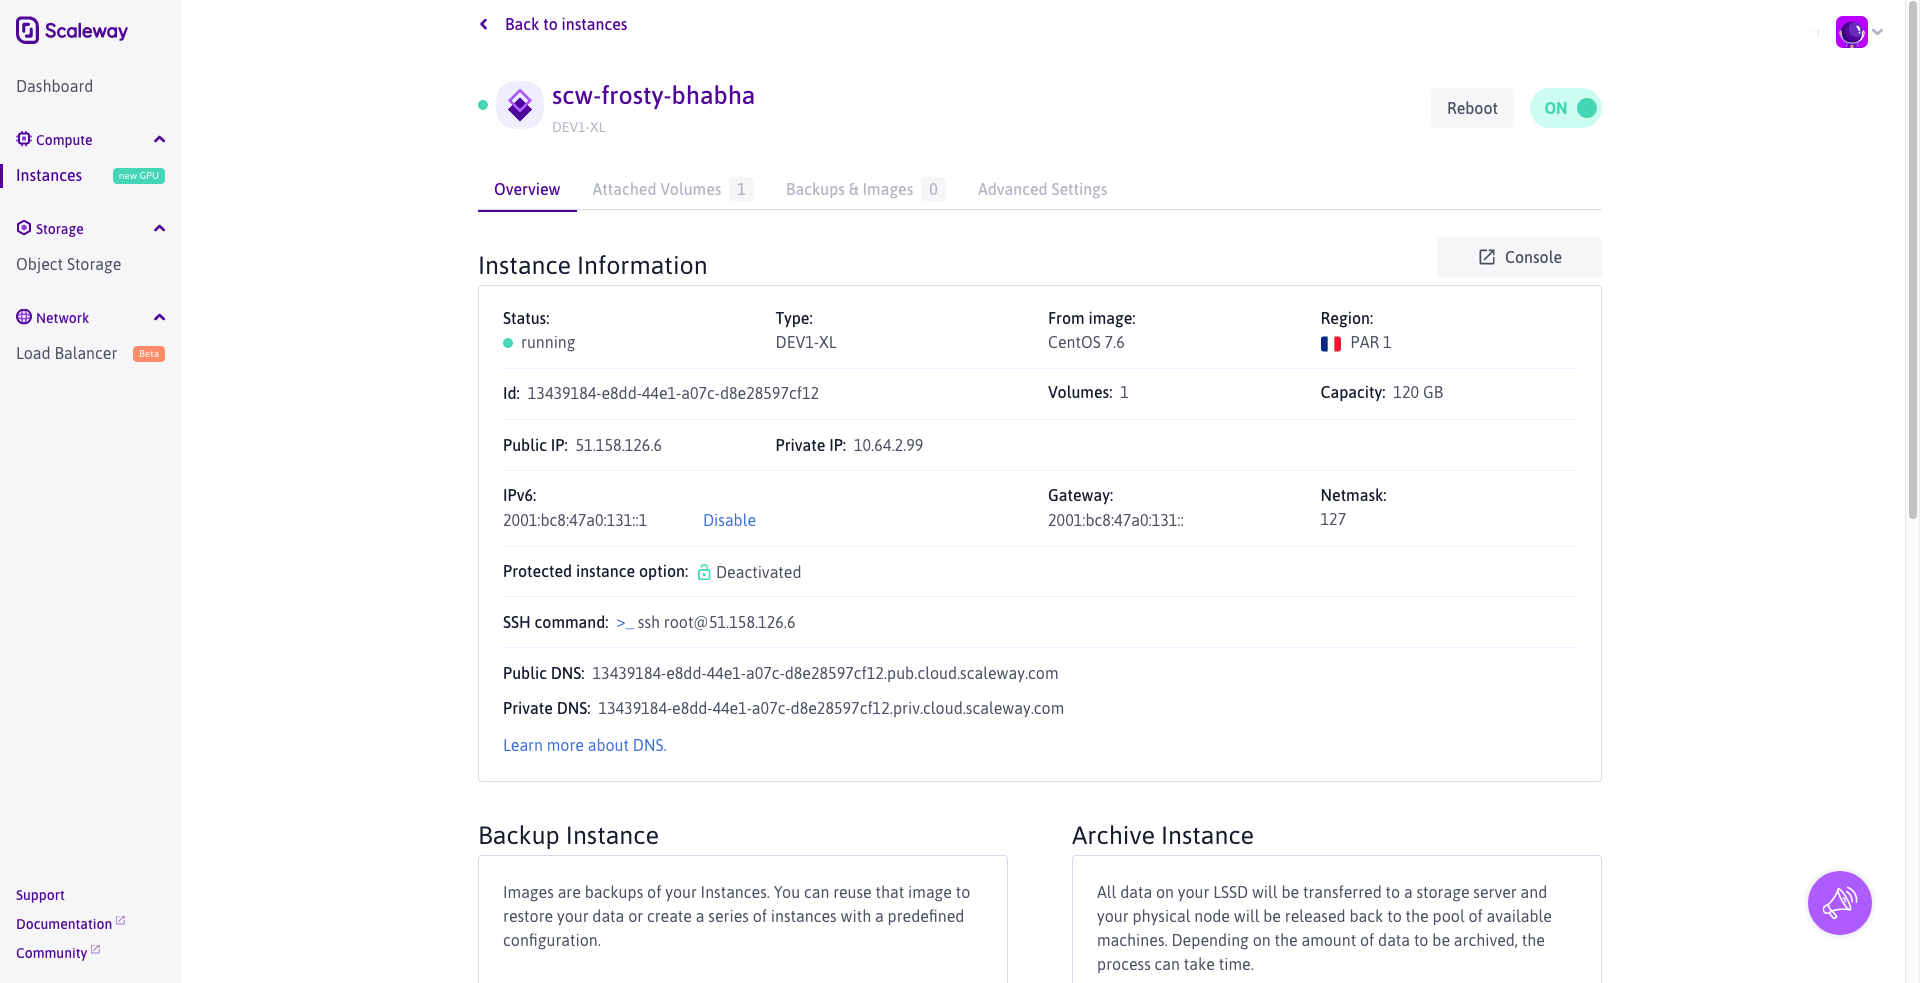
Запущенный инстанс
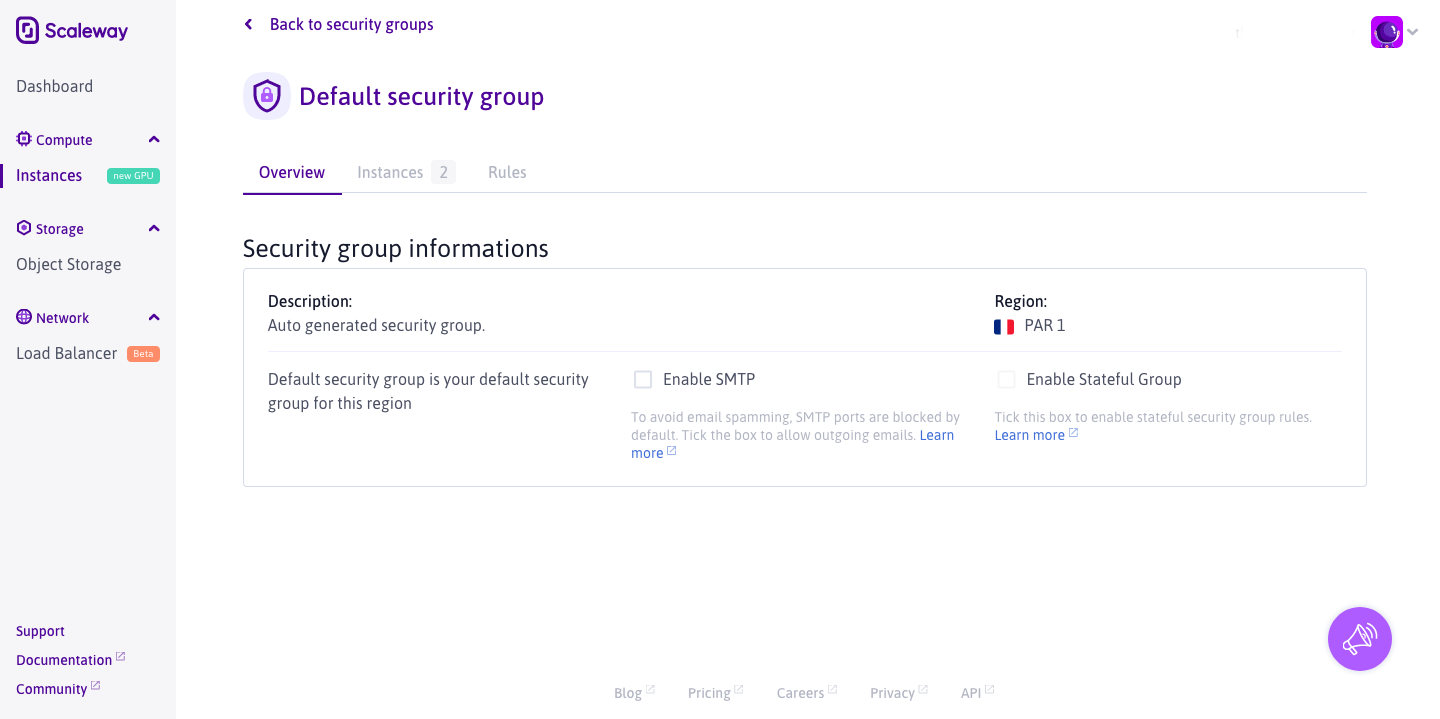
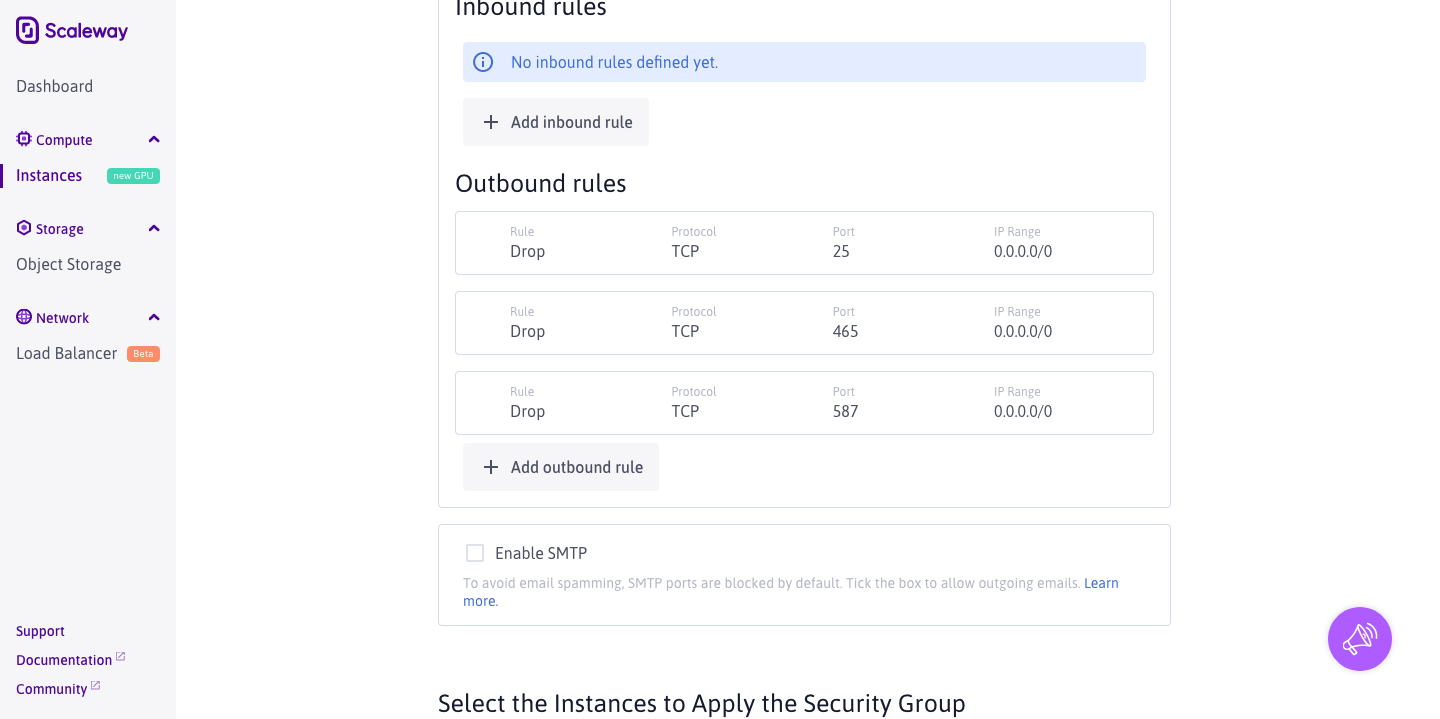
Настройки политик безопасности. Можно создать несколько профилей и в них по разному настроит фаервол.
Можно сделать снапшот диска. Диски кстати можно отсодинять от одной виртуалки и присоединять к другой.

Тестирование сервера за 2.99 евро (DEV1-S) c 2 ядрами CPU AMD Epyc, 2Gb RAM и 20Gb SSD NVMe
Distro:
====================================================
cat /etc/centos-release
-----------
CentOS Linux release 7.6.1810 (Core)

Kernel info:
====================================================
uname -a
-----------
Linux scw-objective-vaughan 3.10.0-957.5.1.el7.x86_64 #1 SMP Fri Feb 1 14:54:57 UTC 2019 x86_64 x86_64 x86_64 GNU/Linux

Inxi:
====================================================
inxi -b
-----------
System:    Host: scw-objective-vaughan Kernel: 3.10.0-957.5.1.el7.x86_64 x86_64 bits: 64 Console: N/A
           Distro: CentOS Linux release 7.6.1810 (Core)
Machine:   Type: Kvm System: Scaleway product: Standard PC (i440FX + PIIX, 1996) v: pc-i440fx-bionic serial: N/A
           Mobo: N/A model: N/A serial: N/A UEFI: EFI Development Kit II / OVMF v: 0.0.0 date: 02/06/2015
CPU:       2x Single Core (4-Die): AMD EPYC 7281 type: MCM SMP speed: 2096 MHz
Graphics:  Message: No Device data found.
           Display: server: No display server data found. Headless machine? tty: 204x25
           Message: Unable to show advanced data. Required tool glxinfo missing.
Network:   Device-1: Intel 82371AB/EB/MB PIIX4 ACPI type: network bridge driver: piix4_smbus
           Device-2: Red Hat Virtio network driver: virtio-pci
Drives:    Local Storage: total: 18.63 GiB used: 917.3 MiB (4.8%)
Info:      Processes: 74 Uptime: 3m Memory: 1.79 GiB used: 134.3 MiB (7.3%) Init: systemd runlevel: 3 Shell: test.sh
           inxi: 3.0.32

CPU Info:
====================================================
cat /proc/cpuinfo
-----------
processor	: 0
vendor_id	: AuthenticAMD
cpu family	: 23
model		: 1
model name	: AMD EPYC 7281 16-Core Processor
stepping	: 2
microcode	: 0x1000065
cpu MHz		: 2096.056
cache size	: 512 KB
physical id	: 0
siblings	: 1
core id		: 0
cpu cores	: 1
apicid		: 0
initial apicid	: 0
fpu		: yes
fpu_exception	: yes
cpuid level	: 13
wp		: yes
flags		: fpu vme de pse tsc msr pae mce cx8 apic sep mtrr pge mca cmov pat pse36 clflush mmx fxsr sse sse2 syscall nx mmxext fxsr_opt pdpe1gb rdtscp lm art rep_good nopl extd_apicid eagerfpu pni pclmulqdq ssse3 fma cx16 sse4_1 sse4_2 x2apic movbe popcnt tsc_deadline_timer aes xsave avx f16c rdrand hypervisor lahf_lm cmp_legacy svm cr8_legacy abm sse4a misalignsse 3dnowprefetch osvw retpoline_amd ssbd ibpb vmmcall fsgsbase tsc_adjust bmi1 avx2 smep bmi2 rdseed adx smap clflushopt sha_ni xsaveopt xsavec xgetbv1 virt_ssbd arat npt nrip_save
bogomips	: 4192.11
TLB size	: 1024 4K pages
clflush size	: 64
cache_alignment	: 64
address sizes	: 40 bits physical, 48 bits virtual
power management:

processor	: 1
vendor_id	: AuthenticAMD
cpu family	: 23
model		: 1
model name	: AMD EPYC 7281 16-Core Processor
stepping	: 2
microcode	: 0x1000065
cpu MHz		: 2096.056
cache size	: 512 KB
physical id	: 1
siblings	: 1
core id		: 0
cpu cores	: 1
apicid		: 1
initial apicid	: 1
fpu		: yes
fpu_exception	: yes
cpuid level	: 13
wp		: yes
flags		: fpu vme de pse tsc msr pae mce cx8 apic sep mtrr pge mca cmov pat pse36 clflush mmx fxsr sse sse2 syscall nx mmxext fxsr_opt pdpe1gb rdtscp lm art rep_good nopl extd_apicid eagerfpu pni pclmulqdq ssse3 fma cx16 sse4_1 sse4_2 x2apic movbe popcnt tsc_deadline_timer aes xsave avx f16c rdrand hypervisor lahf_lm cmp_legacy svm cr8_legacy abm sse4a misalignsse 3dnowprefetch osvw retpoline_amd ssbd ibpb vmmcall fsgsbase tsc_adjust bmi1 avx2 smep bmi2 rdseed adx smap clflushopt sha_ni xsaveopt xsavec xgetbv1 virt_ssbd arat npt nrip_save
bogomips	: 4192.11
TLB size	: 1024 4K pages
clflush size	: 64
cache_alignment	: 64
address sizes	: 40 bits physical, 48 bits virtual
power management:


Memory Info:
====================================================
cat /proc/meminfo
-----------
MemTotal:        1878748 kB
MemFree:         1285912 kB
MemAvailable:    1581256 kB
Buffers:           32524 kB
Cached:           438996 kB
SwapCached:            0 kB
Active:           274252 kB
Inactive:         212932 kB
Active(anon):      15812 kB
Inactive(anon):    16440 kB
Active(file):     258440 kB
Inactive(file):   196492 kB
Unevictable:           0 kB
Mlocked:               0 kB
SwapTotal:             0 kB
SwapFree:              0 kB
Dirty:              2248 kB
Writeback:             0 kB
AnonPages:         15592 kB
Mapped:            13844 kB
Shmem:             16636 kB
Slab:              78304 kB
SReclaimable:      55776 kB
SUnreclaim:        22528 kB
KernelStack:        1216 kB
PageTables:         2276 kB
NFS_Unstable:          0 kB
Bounce:                0 kB
WritebackTmp:          0 kB
CommitLimit:      939372 kB
Committed_AS:      80520 kB
VmallocTotal:   34359738367 kB
VmallocUsed:        5992 kB
VmallocChunk:   34359730288 kB
HardwareCorrupted:     0 kB
AnonHugePages:         0 kB
CmaTotal:              0 kB
CmaFree:               0 kB
HugePages_Total:       0
HugePages_Free:        0
HugePages_Rsvd:        0
HugePages_Surp:        0
Hugepagesize:       2048 kB
DirectMap4k:       53884 kB
DirectMap2M:     2039808 kB
DirectMap1G:           0 kB

Disk Info:
====================================================
df -HT
-----------
Filesystem     Type      Size  Used Avail Use% Mounted on
/dev/vda1      ext4       20G  959M   18G   6% /
devtmpfs       devtmpfs  955M     0  955M   0% /dev
tmpfs          tmpfs     962M     0  962M   0% /dev/shm
tmpfs          tmpfs     962M   18M  945M   2% /run
tmpfs          tmpfs     962M     0  962M   0% /sys/fs/cgroup
/dev/vda15     vfat      104M  3.9M  100M   4% /boot/efi
tmpfs          tmpfs     193M     0  193M   0% /run/user/0

Percona Tools summary:
====================================================
pt-summary
-----------
# Percona Toolkit System Summary Report ######################
        Date | 2019-04-06 19:38:09 UTC (local TZ: UTC +0000)
    Hostname | scw-objective-vaughan
      Uptime | 3 min,  1 user,  load average: 0.59, 0.33, 0.13
      System | Scaleway; Standard PC (i440FX + PIIX, 1996); vpc-i440fx-bionic (Other)
 Service Tag | Not Specified
    Platform | Linux
     Release | CentOS Linux release 7.6.1810 (Core)
      Kernel | 3.10.0-957.5.1.el7.x86_64
Architecture | CPU = 64-bit, OS = 64-bit
   Threading | NPTL 2.17
     SELinux | Enforcing
 Virtualized | VMWare
# Processor ##################################################
  Processors | physical = 2, cores = 2, virtual = 2, hyperthreading = no
      Speeds | 2x2096.056
      Models | 2xAMD EPYC 7281 16-Core Processor
      Caches | 2x512 KB
# Memory #####################################################
       Total | 1.8G
        Free | 1.2G
        Used | physical = 43.3M, swap allocated = 0.0, swap used = 0.0, virtual = 43.3M
      Shared | 16.2M
     Buffers | 538.3M
      Caches | 1.5G
       Dirty | 2372 kB
     UsedRSS | 59.1M
  Swappiness | 60
 DirtyPolicy | 20, 10
 DirtyStatus | 0, 0
  Locator   Size     Speed             Form Factor   Type          Type Detail
  ========= ======== ================= ============= ============= ===========
  DIMM 0    2048 MB  Unknown           DIMM          RAM           Other
# Mounted Filesystems ########################################
  Filesystem  Size Used Type     Opts                                                                                             Mountpoint
  /dev/vda1    19G   6% ext4     rw,relatime,seclabel,data=ordered                                                                /
  /dev/vda15   99M   4% vfat     rw,relatime,fmask=0022,dmask=0022,codepage=437,iocharset=ascii,shortname=mixed,errors=remount-ro /boot/efi
  devtmpfs    911M   0% devtmpfs rw,nosuid,seclabel,size=932596k,nr_inodes=233149,mode=755                                        /dev
  tmpfs       184M   0% tmpfs    rw,nosuid,nodev,seclabel                                                                         /run/user/0
  tmpfs       184M   0% tmpfs    rw,nosuid,nodev,seclabel,mode=755                                                                /run/user/0
  tmpfs       184M   0% tmpfs    rw,nosuid,nodev,relatime,seclabel,size=187876k,mode=700                                          /run/user/0
  tmpfs       184M   0% tmpfs    ro,nosuid,nodev,noexec,seclabel,mode=755                                                         /run/user/0
  tmpfs       918M   0% tmpfs    rw,nosuid,nodev,seclabel                                                                         /dev/shm
  tmpfs       918M   0% tmpfs    rw,nosuid,nodev,seclabel,mode=755                                                                /dev/shm
  tmpfs       918M   0% tmpfs    rw,nosuid,nodev,relatime,seclabel,size=187876k,mode=700                                          /dev/shm
  tmpfs       918M   0% tmpfs    ro,nosuid,nodev,noexec,seclabel,mode=755                                                         /dev/shm
  tmpfs       918M   0% tmpfs    rw,nosuid,nodev,seclabel                                                                         /sys/fs/cgroup
  tmpfs       918M   0% tmpfs    rw,nosuid,nodev,seclabel,mode=755                                                                /sys/fs/cgroup
  tmpfs       918M   0% tmpfs    rw,nosuid,nodev,relatime,seclabel,size=187876k,mode=700                                          /sys/fs/cgroup
  tmpfs       918M   0% tmpfs    ro,nosuid,nodev,noexec,seclabel,mode=755                                                         /sys/fs/cgroup
  tmpfs       918M   2% tmpfs    rw,nosuid,nodev,seclabel                                                                         /run
  tmpfs       918M   2% tmpfs    rw,nosuid,nodev,seclabel,mode=755                                                                /run
  tmpfs       918M   2% tmpfs    rw,nosuid,nodev,relatime,seclabel,size=187876k,mode=700                                          /run
  tmpfs       918M   2% tmpfs    ro,nosuid,nodev,noexec,seclabel,mode=755                                                         /run
# Disk Schedulers And Queue Size #############################
         vda | [mq-deadline] 256
# Disk Partioning ############################################
Device       Type      Start        End               Size
============ ==== ========== ========== ==================
/dev/vda     Disk                              20000000000
# Kernel Inode State #########################################
dentry-state | 106559	94460	45	0	0	0
     file-nr | 704	0	184231
    inode-nr | 28074	299
# LVM Volumes ################################################
Unable to collect information
# LVM Volume Groups ##########################################
Unable to collect information
# RAID Controller ############################################
  Controller | No RAID controller detected
# Network Config #############################################
  Controller | Red Hat, Inc. Virtio network device
 FIN Timeout | 60
  Port Range | 60999
# Interface Statistics #######################################
  interface  rx_bytes rx_packets  rx_errors   tx_bytes tx_packets  tx_errors
  ========= ========= ========== ========== ========== ========== ==========
  lo                0          0          0          0          0          0
  eth0      125000000      25000          0    1750000      10000          0
# Network Connections ########################################
  Connections from remote IP addresses
    176.116.137.36      1
  Connections to local IP addresses
    10.64.16.145        1
  Connections to top 10 local ports
    22                  1
  States of connections
    ESTABLISHED         1
    LISTEN              4
# Top Processes ##############################################
  PID USER      PR  NI    VIRT    RES    SHR S  %CPU %MEM     TIME+ COMMAND
10316 root      20   0   59596   1964   1448 R   6.7  0.1   0:00.01 top
    1 root      20   0  127916   6584   4164 S   0.0  0.4   0:01.79 systemd
    2 root      20   0       0      0      0 S   0.0  0.0   0:00.00 kthreadd
    3 root      20   0       0      0      0 S   0.0  0.0   0:00.11 ksoftirqd/0
    4 root      20   0       0      0      0 S   0.0  0.0   0:00.00 kworker/0:0
    5 root       0 -20       0      0      0 S   0.0  0.0   0:00.00 kworker/0:+
    6 root      20   0       0      0      0 S   0.0  0.0   0:00.50 kworker/u4+
    7 root      rt   0       0      0      0 S   0.0  0.0   0:00.02 migration/0
    8 root      20   0       0      0      0 S   0.0  0.0   0:00.00 rcu_bh
# Notable Processes ##########################################
  PID    OOM    COMMAND
 2848    -17    sshd
# Simplified and fuzzy rounded vmstat (wait please) ##########
  procs  ---swap-- -----io---- ---system---- --------cpu--------
   r  b    si   so    bi    bo     ir     cs  us  sy  il  wa  st
   1  0     0    0   300  1250    500    500  14   6  72   5   4
   0  0     0    0   100  3000   1250   1250   4  12  78   3   4
   1  0     0    0     0     0     15     15   0   0 100   0   0
   0  0     0    0     0     0     30     25   0   0 100   0   0
   0  0     0    0     0     0     15     20   0   0 100   0   0
# Memory mamagement ##########################################
Transparent huge pages are enabled.
# The End ####################################################

Starting tests:
====================================================
====================================================

DD:
====================================================
dd if=/dev/zero of=test bs=64k count=16k conv=fdatasync 2>&1
rm -f test
-----------
16384+0 records in
16384+0 records out
1073741824 bytes (1.1 GB) copied, 10.5781 s, 102 MB/s
16384+0 records in
16384+0 records out
1073741824 bytes (1.1 GB) copied, 4.56384 s, 235 MB/s
16384+0 records in
16384+0 records out
1073741824 bytes (1.1 GB) copied, 4.95216 s, 217 MB/s

Sysbench CPU:
====================================================
sysbench cpu --cpu-max-prime=20000 --num-threads=1 run
-----------
sysbench 1.0.17 (using system LuaJIT 2.0.4)

Running the test with following options:
Number of threads: 1
Initializing random number generator from current time


Prime numbers limit: 20000

Initializing worker threads...

Threads started!

CPU speed:
    events per second:   472.03

General statistics:
    total time:                          10.0018s
    total number of events:              4722

Latency (ms):
         min:                                    1.97
         avg:                                    2.12
         max:                                    4.80
         95th percentile:                        2.22
         sum:                                 9992.24

Threads fairness:
    events (avg/stddev):           4722.0000/0.00
    execution time (avg/stddev):   9.9922/0.00


Sysbench CPU Mutex 64:
====================================================
sysbench mutex --threads=64 run
-----------
sysbench 1.0.17 (using system LuaJIT 2.0.4)

Running the test with following options:
Number of threads: 64
Initializing random number generator from current time


Initializing worker threads...

Threads started!


General statistics:
    total time:                          16.8553s
    total number of events:              64

Latency (ms):
         min:                                16212.09
         avg:                                16595.18
         max:                                16830.91
         95th percentile:                    16819.24
         sum:                              1062091.67

Threads fairness:
    events (avg/stddev):           1.0000/0.00
    execution time (avg/stddev):   16.5952/0.19


Memory size for Sysbench Memory test: 1G
Disk space for Sysbench Disk test: 2G
Sysbench Memory test:
====================================================
sysbench memory --num-threads=4 --memory-total-size=1G run
-----------
WARNING: --num-threads is deprecated, use --threads instead
sysbench 1.0.17 (using system LuaJIT 2.0.4)

Running the test with following options:
Number of threads: 4
Initializing random number generator from current time


Running memory speed test with the following options:
  block size: 1KiB
  total size: 1024MiB
  operation: write
  scope: global

Initializing worker threads...

Threads started!

Total operations: 1048576 (2560026.59 per second)

1024.00 MiB transferred (2500.03 MiB/sec)


General statistics:
    total time:                          0.4070s
    total number of events:              1048576

Latency (ms):
         min:                                    0.00
         avg:                                    0.00
         max:                                   15.01
         95th percentile:                        0.00
         sum:                                  897.79

Threads fairness:
    events (avg/stddev):           262144.0000/0.00
    execution time (avg/stddev):   0.2244/0.02


Sysbench Disk test:
====================================================
sysbench fileio --file-total-size=2G prepare
-----------
sysbench 1.0.17 (using system LuaJIT 2.0.4)

128 files, 16384Kb each, 2048Mb total
Creating files for the test...
Extra file open flags: (none)
Creating file test_file.0
...
Creating file test_file.127
2147483648 bytes written in 16.27 seconds (125.84 MiB/sec).
sysbench fileio --file-total-size=2G --file-test-mode=rndrw --time=300 --max-requests=0 run
-----------
sysbench 1.0.17 (using system LuaJIT 2.0.4)

Running the test with following options:
Number of threads: 1
Initializing random number generator from current time


Extra file open flags: (none)
128 files, 16MiB each
2GiB total file size
Block size 16KiB
Number of IO requests: 0
Read/Write ratio for combined random IO test: 1.50
Periodic FSYNC enabled, calling fsync() each 100 requests.
Calling fsync() at the end of test, Enabled.
Using synchronous I/O mode
Doing random r/w test
Initializing worker threads...

Threads started!


File operations:
    reads/s:                      360.95
    writes/s:                     240.63
    fsyncs/s:                     770.44

Throughput:
    read, MiB/s:                  5.64
    written, MiB/s:               3.76

General statistics:
    total time:                          300.0378s
    total number of events:              411536

Latency (ms):
         min:                                    0.00
         avg:                                    0.73
         max:                                  221.22
         95th percentile:                        4.18
         sum:                               299029.68

Threads fairness:
    events (avg/stddev):           411536.0000/0.00
    execution time (avg/stddev):   299.0297/0.00


Speedtest cli:
====================================================
speedtest-cli
-----------
Retrieving speedtest.net configuration...
Testing from ONLINE SAS (51.158.113.127)...
Retrieving speedtest.net server list...
Selecting best server based on ping...
Hosted by CCleaner (Paris) [2.04 km]: 2.941 ms
Testing download speed................................................................................
Download: 728.73 Mbit/s
Testing upload speed....................................................................................................
Upload: 332.69 Mbit/s

7-zip benchmark:
====================================================
7za b
-----------

7-Zip (a) [64] 16.02 : Copyright (c) 1999-2016 Igor Pavlov : 2016-05-21
p7zip Version 16.02 (locale=C,Utf16=off,HugeFiles=on,64 bits,2 CPUs AMD EPYC 7281 16-Core Processor                 (800F12),ASM,AES-NI)

AMD EPYC 7281 16-Core Processor                 (800F12)
CPU Freq:  1857  2172  2292  2359  2098  2408  2260  2292  2270

RAM size:    1834 MB,  # CPU hardware threads:   2
RAM usage:    441 MB,  # Benchmark threads:      2

                       Compressing  |                  Decompressing
Dict     Speed Usage    R/U Rating  |      Speed Usage    R/U Rating
         KiB/s     %   MIPS   MIPS  |      KiB/s     %   MIPS   MIPS

22:       2815   158   1729   2739  |      43786   199   1881   3739
23:       2975   165   1837   3031  |      37569   190   1712   3252
24:       3433   181   2044   3692  |      43600   200   1917   3828
25:       2767   173   1827   3160  |      36775   191   1711   3273
----------------------------------  | ------------------------------
Avr:             169   1859   3156  |              195   1805   3523
Tot:             182   1832   3339
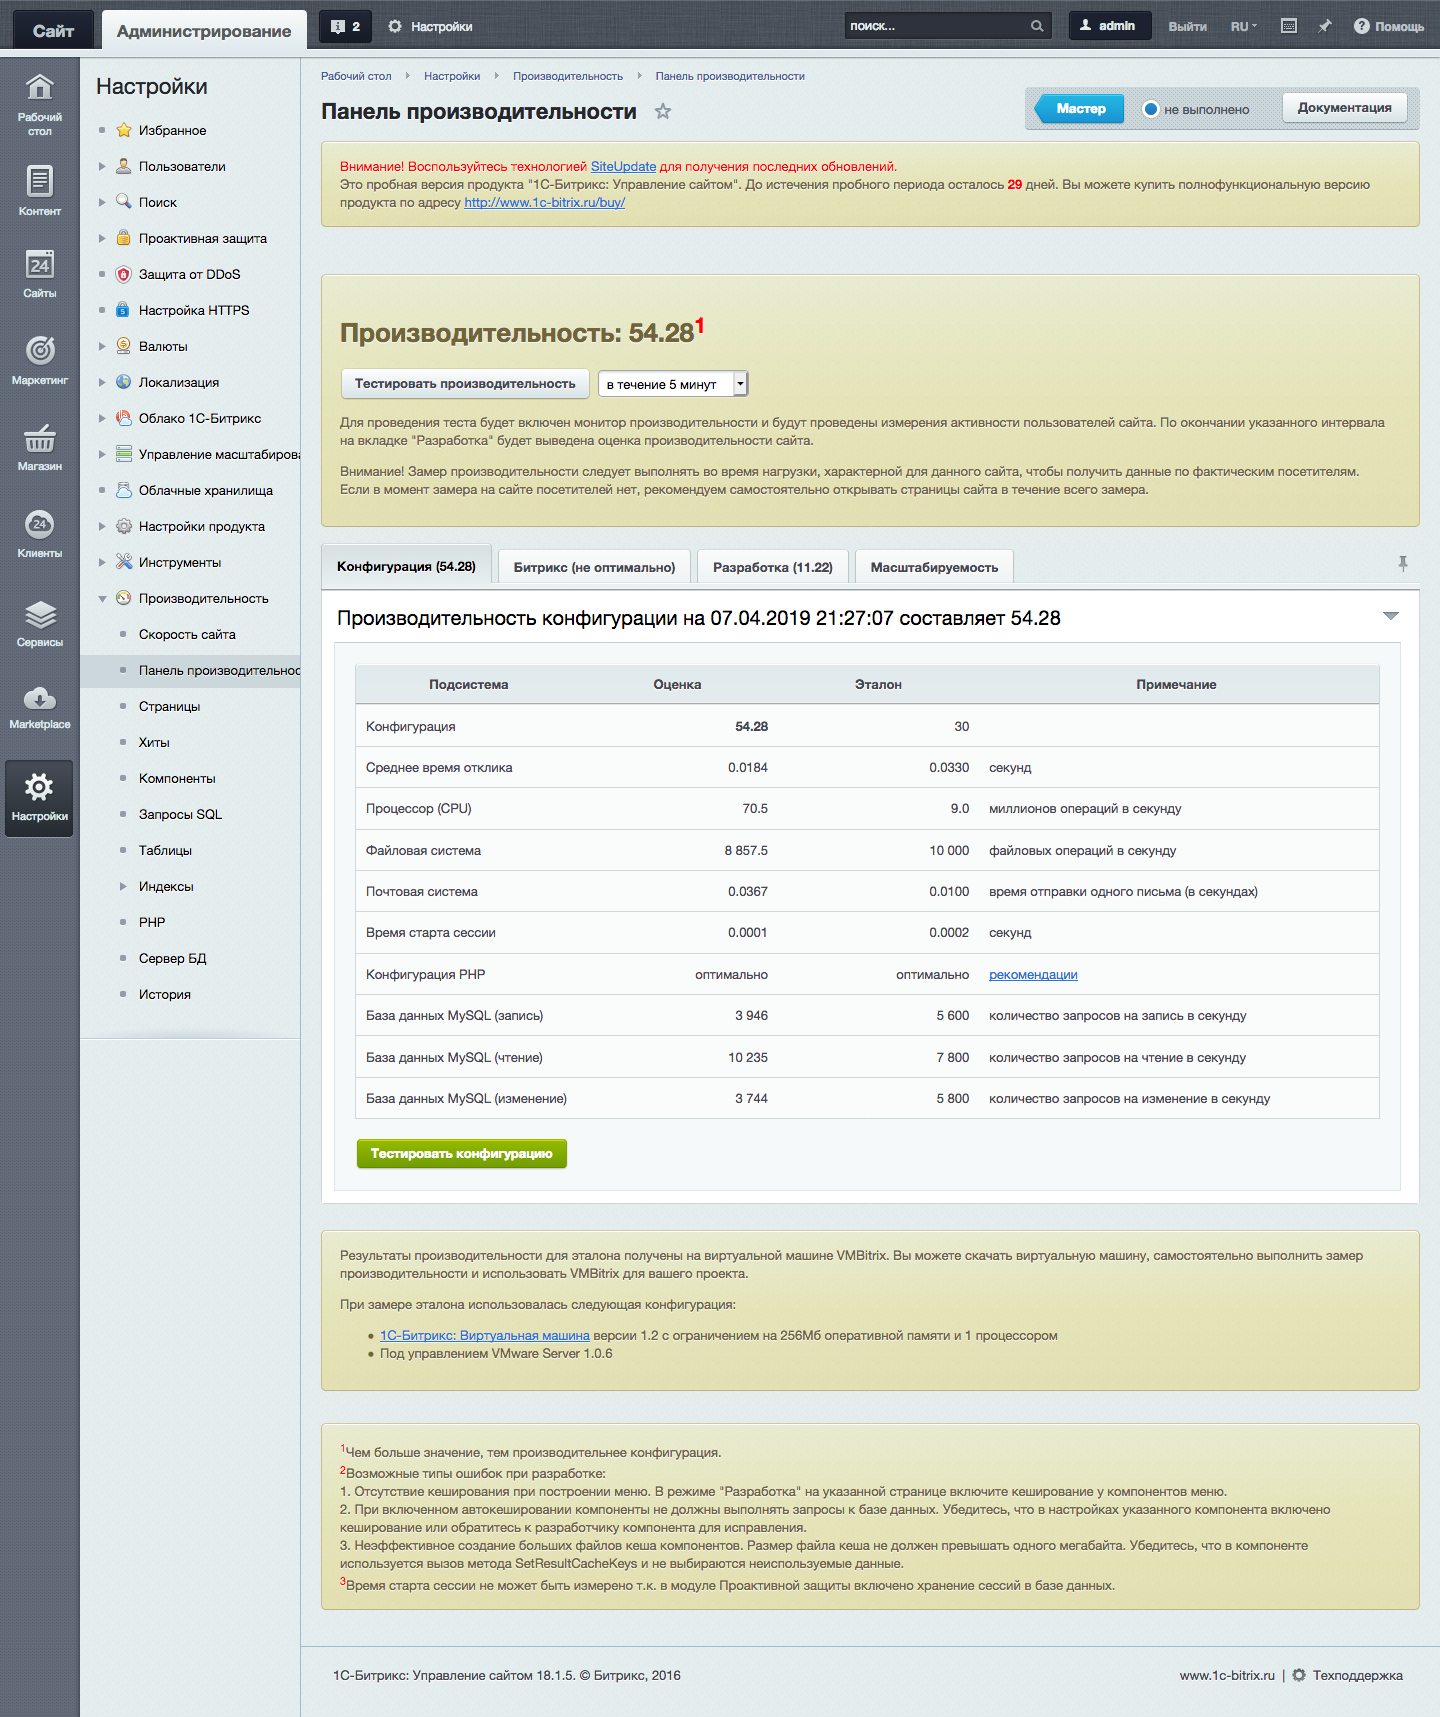
Вот кстати результаты в Битрикс-попугаях на редакции “Малый Бизнес” в окружении bitrix-env.
Тестирование сервера за 23.99 евро (DEV1-XL) c 4 ядрами CPU AMD Epyc, 12Gb RAM и 120Gb SSD NVMe
Distro:
====================================================
cat /etc/centos-release
-----------
CentOS Linux release 7.6.1810 (Core)

Kernel info:
====================================================
uname -a
-----------
Linux scw-frosty-bhabha 3.10.0-957.5.1.el7.x86_64 #1 SMP Fri Feb 1 14:54:57 UTC 2019 x86_64 x86_64 x86_64 GNU/Linux

Inxi:
====================================================
inxi -b
-----------
System:    Host: scw-frosty-bhabha Kernel: 3.10.0-957.5.1.el7.x86_64 x86_64 bits: 64 Console: N/A
           Distro: CentOS Linux release 7.6.1810 (Core)
Machine:   Type: Kvm System: Scaleway product: Standard PC (i440FX + PIIX, 1996) v: pc-i440fx-bionic serial: N/A
           Mobo: N/A model: N/A serial: N/A UEFI: EFI Development Kit II / OVMF v: 0.0.0 date: 02/06/2015
CPU:       4x Single Core (4-Die): AMD EPYC 7281 type: MCM SMP speed: 2096 MHz
Graphics:  Message: No Device data found.
           Display: server: No display server data found. Headless machine? tty: 202x24
           Message: Unable to show advanced data. Required tool glxinfo missing.
Network:   Device-1: Intel 82371AB/EB/MB PIIX4 ACPI type: network bridge driver: piix4_smbus
           Device-2: Red Hat Virtio network driver: virtio-pci
Drives:    Local Storage: total: 111.76 GiB used: 4.25 GiB (3.8%)
Info:      Processes: 99 Uptime: 43m Memory: 11.57 GiB used: 493.4 MiB (4.2%) Init: systemd runlevel: 3 Shell: test.sh
           inxi: 3.0.32

CPU Info:
====================================================
cat /proc/cpuinfo
-----------
processor	: 0
vendor_id	: AuthenticAMD
cpu family	: 23
model		: 1
model name	: AMD EPYC 7281 16-Core Processor
stepping	: 2
microcode	: 0x1000065
cpu MHz		: 2096.056
cache size	: 512 KB
physical id	: 0
siblings	: 1
core id		: 0
cpu cores	: 1
apicid		: 0
initial apicid	: 0
fpu		: yes
fpu_exception	: yes
cpuid level	: 13
wp		: yes
flags		: fpu vme de pse tsc msr pae mce cx8 apic sep mtrr pge mca cmov pat pse36 clflush mmx fxsr sse sse2 syscall nx mmxext fxsr_opt pdpe1gb rdtscp lm art rep_good nopl extd_apicid eagerfpu pni pclmulqdq ssse3 fma cx16 sse4_1 sse4_2 x2apic movbe popcnt tsc_deadline_timer aes xsave avx f16c rdrand hypervisor lahf_lm cmp_legacy svm cr8_legacy abm sse4a misalignsse 3dnowprefetch osvw retpoline_amd ssbd ibpb vmmcall fsgsbase tsc_adjust bmi1 avx2 smep bmi2 rdseed adx smap clflushopt sha_ni xsaveopt xsavec xgetbv1 virt_ssbd arat npt nrip_save
bogomips	: 4192.11
TLB size	: 1024 4K pages
clflush size	: 64
cache_alignment	: 64
address sizes	: 40 bits physical, 48 bits virtual
power management:

processor	: 1
vendor_id	: AuthenticAMD
cpu family	: 23
model		: 1
model name	: AMD EPYC 7281 16-Core Processor
stepping	: 2
microcode	: 0x1000065
cpu MHz		: 2096.056
cache size	: 512 KB
physical id	: 1
siblings	: 1
core id		: 0
cpu cores	: 1
apicid		: 1
initial apicid	: 1
fpu		: yes
fpu_exception	: yes
cpuid level	: 13
wp		: yes
flags		: fpu vme de pse tsc msr pae mce cx8 apic sep mtrr pge mca cmov pat pse36 clflush mmx fxsr sse sse2 syscall nx mmxext fxsr_opt pdpe1gb rdtscp lm art rep_good nopl extd_apicid eagerfpu pni pclmulqdq ssse3 fma cx16 sse4_1 sse4_2 x2apic movbe popcnt tsc_deadline_timer aes xsave avx f16c rdrand hypervisor lahf_lm cmp_legacy svm cr8_legacy abm sse4a misalignsse 3dnowprefetch osvw retpoline_amd ssbd ibpb vmmcall fsgsbase tsc_adjust bmi1 avx2 smep bmi2 rdseed adx smap clflushopt sha_ni xsaveopt xsavec xgetbv1 virt_ssbd arat npt nrip_save
bogomips	: 4192.11
TLB size	: 1024 4K pages
clflush size	: 64
cache_alignment	: 64
address sizes	: 40 bits physical, 48 bits virtual
power management:

processor	: 2
vendor_id	: AuthenticAMD
cpu family	: 23
model		: 1
model name	: AMD EPYC 7281 16-Core Processor
stepping	: 2
microcode	: 0x1000065
cpu MHz		: 2096.056
cache size	: 512 KB
physical id	: 2
siblings	: 1
core id		: 0
cpu cores	: 1
apicid		: 2
initial apicid	: 2
fpu		: yes
fpu_exception	: yes
cpuid level	: 13
wp		: yes
flags		: fpu vme de pse tsc msr pae mce cx8 apic sep mtrr pge mca cmov pat pse36 clflush mmx fxsr sse sse2 syscall nx mmxext fxsr_opt pdpe1gb rdtscp lm art rep_good nopl extd_apicid eagerfpu pni pclmulqdq ssse3 fma cx16 sse4_1 sse4_2 x2apic movbe popcnt tsc_deadline_timer aes xsave avx f16c rdrand hypervisor lahf_lm cmp_legacy svm cr8_legacy abm sse4a misalignsse 3dnowprefetch osvw retpoline_amd ssbd ibpb vmmcall fsgsbase tsc_adjust bmi1 avx2 smep bmi2 rdseed adx smap clflushopt sha_ni xsaveopt xsavec xgetbv1 virt_ssbd arat npt nrip_save
bogomips	: 4192.11
TLB size	: 1024 4K pages
clflush size	: 64
cache_alignment	: 64
address sizes	: 40 bits physical, 48 bits virtual
power management:

processor	: 3
vendor_id	: AuthenticAMD
cpu family	: 23
model		: 1
model name	: AMD EPYC 7281 16-Core Processor
stepping	: 2
microcode	: 0x1000065
cpu MHz		: 2096.056
cache size	: 512 KB
physical id	: 3
siblings	: 1
core id		: 0
cpu cores	: 1
apicid		: 3
initial apicid	: 3
fpu		: yes
fpu_exception	: yes
cpuid level	: 13
wp		: yes
flags		: fpu vme de pse tsc msr pae mce cx8 apic sep mtrr pge mca cmov pat pse36 clflush mmx fxsr sse sse2 syscall nx mmxext fxsr_opt pdpe1gb rdtscp lm art rep_good nopl extd_apicid eagerfpu pni pclmulqdq ssse3 fma cx16 sse4_1 sse4_2 x2apic movbe popcnt tsc_deadline_timer aes xsave avx f16c rdrand hypervisor lahf_lm cmp_legacy svm cr8_legacy abm sse4a misalignsse 3dnowprefetch osvw retpoline_amd ssbd ibpb vmmcall fsgsbase tsc_adjust bmi1 avx2 smep bmi2 rdseed adx smap clflushopt sha_ni xsaveopt xsavec xgetbv1 virt_ssbd arat npt nrip_save
bogomips	: 4192.11
TLB size	: 1024 4K pages
clflush size	: 64
cache_alignment	: 64
address sizes	: 40 bits physical, 48 bits virtual
power management:


Memory Info:
====================================================
cat /proc/meminfo
-----------
MemTotal:       12134248 kB
MemFree:         7711132 kB
MemAvailable:   11555968 kB
Buffers:           90088 kB
Cached:          3844076 kB
SwapCached:            0 kB
Active:           693844 kB
Inactive:        3349252 kB
Active(anon):     109164 kB
Inactive(anon):    16460 kB
Active(file):     584680 kB
Inactive(file):  3332792 kB
Unevictable:           0 kB
Mlocked:               0 kB
SwapTotal:       2097148 kB
SwapFree:        2097148 kB
Dirty:               100 kB
Writeback:             0 kB
AnonPages:        108788 kB
Mapped:            62640 kB
Shmem:             16696 kB
Slab:             273756 kB
SReclaimable:     240300 kB
SUnreclaim:        33456 kB
KernelStack:        2336 kB
PageTables:         3936 kB
NFS_Unstable:          0 kB
Bounce:                0 kB
WritebackTmp:          0 kB
CommitLimit:     8164272 kB
Committed_AS:     556268 kB
VmallocTotal:   34359738367 kB
VmallocUsed:       30680 kB
VmallocChunk:   34359704928 kB
HardwareCorrupted:     0 kB
AnonHugePages:     16384 kB
CmaTotal:              0 kB
CmaFree:               0 kB
HugePages_Total:       0
HugePages_Free:        0
HugePages_Rsvd:        0
HugePages_Surp:        0
Hugepagesize:       2048 kB
DirectMap4k:      156220 kB
DirectMap2M:     8228864 kB
DirectMap1G:     6291456 kB

Disk Info:
====================================================
df -HT
-----------
Filesystem     Type      Size  Used Avail Use% Mounted on
/dev/vda1      ext4      118G  4.6G  109G   5% /
devtmpfs       devtmpfs  6.3G     0  6.3G   0% /dev
tmpfs          tmpfs     6.3G     0  6.3G   0% /dev/shm
tmpfs          tmpfs     6.3G   18M  6.2G   1% /run
tmpfs          tmpfs     6.3G     0  6.3G   0% /sys/fs/cgroup
/dev/vda15     vfat      104M  3.9M  100M   4% /boot/efi
tmpfs          tmpfs     1.3G     0  1.3G   0% /run/user/0

Percona Tools summary:
====================================================
pt-summary
-----------
# Percona Toolkit System Summary Report ######################
        Date | 2019-04-05 16:03:50 UTC (local TZ: MSK +0300)
    Hostname | scw-frosty-bhabha
      Uptime | 43 min,  1 user,  load average: 0.01, 0.15, 0.19
      System | Scaleway; Standard PC (i440FX + PIIX, 1996); vpc-i440fx-bionic (Other)
 Service Tag | Not Specified
    Platform | Linux
     Release | CentOS Linux release 7.6.1810 (Core)
      Kernel | 3.10.0-957.5.1.el7.x86_64
Architecture | CPU = 64-bit, OS = 64-bit
   Threading | NPTL 2.17
     SELinux | Permissive
 Virtualized | VMWare
# Processor ##################################################
  Processors | physical = 4, cores = 4, virtual = 4, hyperthreading = no
      Speeds | 4x2096.056
      Models | 4xAMD EPYC 7281 16-Core Processor
      Caches | 4x512 KB
# Memory #####################################################
       Total | 11.6G
        Free | 7.4G
        Used | physical = 211.3M, swap allocated = 2.0G, swap used = 0.0, virtual = 211.3M
      Shared | 16.3M
     Buffers | 4.0G
      Caches | 11.0G
       Dirty | 104 kB
     UsedRSS | 206.4M
  Swappiness | 60
 DirtyPolicy | 20, 10
 DirtyStatus | 0, 0
  Locator   Size     Speed             Form Factor   Type          Type Detail
  ========= ======== ================= ============= ============= ===========
  DIMM 0    12288 MB Unknown           DIMM          RAM           Other
# Mounted Filesystems ########################################
  Filesystem  Size Used Type     Opts                                                                                             Mountpoint
  /dev/vda1   110G   5% ext4     rw,relatime,seclabel,data=ordered                                                                /
  /dev/vda15   99M   4% vfat     rw,relatime,fmask=0022,dmask=0022,codepage=437,iocharset=ascii,shortname=mixed,errors=remount-ro /boot/efi
  devtmpfs    5.8G   0% devtmpfs rw,nosuid,seclabel,size=6060344k,nr_inodes=1515086,mode=755                                      /dev
  tmpfs       1.2G   0% tmpfs    rw,nosuid,nodev,seclabel                                                                         /run/user/0
  tmpfs       1.2G   0% tmpfs    rw,nosuid,nodev,seclabel,mode=755                                                                /run/user/0
  tmpfs       1.2G   0% tmpfs    rw,nosuid,nodev,relatime,seclabel,size=1213428k,mode=700                                         /run/user/0
  tmpfs       1.2G   0% tmpfs    ro,nosuid,nodev,noexec,seclabel,mode=755                                                         /run/user/0
  tmpfs       5.8G   0% tmpfs    rw,nosuid,nodev,seclabel                                                                         /dev/shm
  tmpfs       5.8G   0% tmpfs    rw,nosuid,nodev,seclabel,mode=755                                                                /dev/shm
  tmpfs       5.8G   0% tmpfs    rw,nosuid,nodev,relatime,seclabel,size=1213428k,mode=700                                         /dev/shm
  tmpfs       5.8G   0% tmpfs    ro,nosuid,nodev,noexec,seclabel,mode=755                                                         /dev/shm
  tmpfs       5.8G   0% tmpfs    rw,nosuid,nodev,seclabel                                                                         /sys/fs/cgroup
  tmpfs       5.8G   0% tmpfs    rw,nosuid,nodev,seclabel,mode=755                                                                /sys/fs/cgroup
  tmpfs       5.8G   0% tmpfs    rw,nosuid,nodev,relatime,seclabel,size=1213428k,mode=700                                         /sys/fs/cgroup
  tmpfs       5.8G   0% tmpfs    ro,nosuid,nodev,noexec,seclabel,mode=755                                                         /sys/fs/cgroup
  tmpfs       5.8G   1% tmpfs    rw,nosuid,nodev,seclabel                                                                         /run
  tmpfs       5.8G   1% tmpfs    rw,nosuid,nodev,seclabel,mode=755                                                                /run
  tmpfs       5.8G   1% tmpfs    rw,nosuid,nodev,relatime,seclabel,size=1213428k,mode=700                                         /run
  tmpfs       5.8G   1% tmpfs    ro,nosuid,nodev,noexec,seclabel,mode=755                                                         /run
# Disk Schedulers And Queue Size #############################
         vda | [mq-deadline] 256
# Disk Partioning ############################################
Device       Type      Start        End               Size
============ ==== ========== ========== ==================
/dev/vda     Disk                             120000000000
# Kernel Inode State #########################################
dentry-state | 311217	294263	45	0	0	0
     file-nr | 1024	0	1200121
    inode-nr | 69059	1920
# LVM Volumes ################################################
Unable to collect information
# LVM Volume Groups ##########################################
Unable to collect information
# RAID Controller ############################################
  Controller | No RAID controller detected
# Network Config #############################################
  Controller | Red Hat, Inc. Virtio network device
 FIN Timeout | 60
  Port Range | 60999
# Interface Statistics #######################################
  interface  rx_bytes rx_packets  rx_errors   tx_bytes tx_packets  tx_errors
  ========= ========= ========== ========== ========== ========== ==========
  lo            12500        100          0      12500        100          0
  eth0      500000000      50000          0    3500000      30000          0
  docker0      300000       5000          0  150000000       7000          0
  br-8ab52f80c426          0          0          0        450          5          0
# Network Connections ########################################
  Connections from remote IP addresses
    46.8.117.33         1
  Connections to local IP addresses
    10.64.2.99          1
  Connections to top 10 local ports
    1822                1
  States of connections
    ESTABLISHED         1
    LISTEN              3
# Top Processes ##############################################
  PID USER      PR  NI    VIRT    RES    SHR S  %CPU %MEM     TIME+ COMMAND
    1 root      20   0  193576   6752   4180 S   0.0  0.1   0:03.78 systemd
    2 root      20   0       0      0      0 S   0.0  0.0   0:00.00 kthreadd
    3 root      20   0       0      0      0 S   0.0  0.0   0:00.37 ksoftirqd/0
    5 root       0 -20       0      0      0 S   0.0  0.0   0:00.00 kworker/0:+
    7 root      rt   0       0      0      0 S   0.0  0.0   0:00.26 migration/0
    8 root      20   0       0      0      0 S   0.0  0.0   0:00.00 rcu_bh
    9 root      20   0       0      0      0 S   0.0  0.0   0:02.76 rcu_sched
   10 root       0 -20       0      0      0 S   0.0  0.0   0:00.00 lru-add-dr+
   11 root      rt   0       0      0      0 S   0.0  0.0   0:00.02 watchdog/0
# Notable Processes ##########################################
  PID    OOM    COMMAND
 7103    -17    sshd
# Simplified and fuzzy rounded vmstat (wait please) ##########
  procs  ---swap-- -----io---- ---system---- --------cpu--------
   r  b    si   so    bi    bo     ir     cs  us  sy  il  wa  st
   1  0     0    0    15   700    150    175   3   1  95   0   0
   0  0     0    0     0     0   1750   1500   2   5  92   0   2
   0  0     0    0     0     0     20     60   0   0 100   0   0
   0  0     0    0     0     0     60    100   0   0 100   0   0
   0  0     0    0     0     0    200    250   0   0  99   0   1
# Memory mamagement ##########################################
Transparent huge pages are enabled.
# The End ####################################################

Starting tests:
====================================================
====================================================

DD:
====================================================
dd if=/dev/zero of=test bs=64k count=16k conv=fdatasync 2>&1
rm -f test
-----------
16384+0 records in
16384+0 records out
1073741824 bytes (1.1 GB) copied, 3.82286 s, 281 MB/s
16384+0 records in
16384+0 records out
1073741824 bytes (1.1 GB) copied, 4.28883 s, 250 MB/s
16384+0 records in
16384+0 records out
1073741824 bytes (1.1 GB) copied, 3.86384 s, 278 MB/s

Sysbench CPU:
====================================================
sysbench cpu --cpu-max-prime=20000 --num-threads=1 run
-----------
sysbench 1.0.17 (using system LuaJIT 2.0.4)

Running the test with following options:
Number of threads: 1
Initializing random number generator from current time


Prime numbers limit: 20000

Initializing worker threads...

Threads started!

CPU speed:
    events per second:   484.14

General statistics:
    total time:                          10.0022s
    total number of events:              4844

Latency (ms):
         min:                                    1.94
         avg:                                    2.06
         max:                                    4.17
         95th percentile:                        2.26
         sum:                                 9990.90

Threads fairness:
    events (avg/stddev):           4844.0000/0.00
    execution time (avg/stddev):   9.9909/0.00


Sysbench CPU Mutex 64:
====================================================
sysbench mutex --threads=64 run
-----------
sysbench 1.0.17 (using system LuaJIT 2.0.4)

Running the test with following options:
Number of threads: 64
Initializing random number generator from current time


Initializing worker threads...

Threads started!


General statistics:
    total time:                          6.2020s
    total number of events:              64

Latency (ms):
         min:                                 4398.28
         avg:                                 5934.64
         max:                                 6185.64
         95th percentile:                     6135.91
         sum:                               379816.76

Threads fairness:
    events (avg/stddev):           1.0000/0.00
    execution time (avg/stddev):   5.9346/0.25


Memory size for Sysbench Memory test:
Disk space for Sysbench Disk test:
Sysbench Memory test:
====================================================
sysbench memory --num-threads=4 --memory-total-size= run
-----------
WARNING: --num-threads is deprecated, use --threads instead
sysbench 1.0.17 (using system LuaJIT 2.0.4)

Running the test with following options:
Number of threads: 4
Initializing random number generator from current time


Running memory speed test with the following options:
  block size: 1KiB
  total size: 0MiB
  operation: write
  scope: global

Initializing worker threads...

Threads started!

Total operations: 43284339 (4327552.38 per second)

42269.86 MiB transferred (4226.13 MiB/sec)


General statistics:
    total time:                          10.0001s
    total number of events:              43284339

Latency (ms):
         min:                                    0.00
         avg:                                    0.00
         max:                                    4.21
         95th percentile:                        0.00
         sum:                                28238.73

Threads fairness:
    events (avg/stddev):           10821084.7500/144016.90
    execution time (avg/stddev):   7.0597/0.06

Speedtest cli:
====================================================
speedtest-cli
-----------
Retrieving speedtest.net configuration...
Testing from ONLINE SAS (51.158.126.6)...
Retrieving speedtest.net server list...
Selecting best server based on ping...
Hosted by CCleaner (Paris) [2.04 km]: 2.577 ms
Testing download speed................................................................................
Download: 273.16 Mbit/s
Testing upload speed....................................................................................................
Upload: 369.80 Mbit/s

7-zip benchmark:
====================================================
7za b
-----------

7-Zip (a) [64] 16.02 : Copyright (c) 1999-2016 Igor Pavlov : 2016-05-21
p7zip Version 16.02 (locale=C,Utf16=off,HugeFiles=on,64 bits,4 CPUs AMD EPYC 7281 16-Core Processor                 (800F12),ASM,AES-NI)

AMD EPYC 7281 16-Core Processor                 (800F12)
CPU Freq:  2390  2395  2467  2486  2473  2459  2483  2529  2300

RAM size:   11849 MB,  # CPU hardware threads:   4
RAM usage:    882 MB,  # Benchmark threads:      4

                       Compressing  |                  Decompressing
Dict     Speed Usage    R/U Rating  |      Speed Usage    R/U Rating
         KiB/s     %   MIPS   MIPS  |      KiB/s     %   MIPS   MIPS

22:       7597   352   2102   7390  |      93592   388   2060   7985
23:       6826   309   2249   6955  |      88140   384   1987   7626
24:       6568   311   2273   7063  |      84841   380   1960   7448
25:       6633   333   2274   7574  |      89302   385   2064   7948
----------------------------------  | ------------------------------
Avr:             326   2225   7246  |              384   2018   7752
Tot:             355   2121   7499
Тестирование сервера START1-XS за 1.99 евро, 1 ядро Intel Atom, 1Gb RAM, 10Gb SSD (старая конфигурация)
Distro:
====================================================
cat /etc/centos-release
-----------
CentOS Linux release 7.6.1810 (Core)

Kernel info:
====================================================
uname -a
-----------
Linux scw-recursing-mahavira 3.10.0-957.5.1.el7.x86_64 #1 SMP Fri Feb 1 14:54:57 UTC 2019 x86_64 x86_64 x86_64 GNU/Linux

Inxi:
====================================================
inxi -b
-----------
System:    Host: scw-recursing-mahavira Kernel: 3.10.0-957.5.1.el7.x86_64 x86_64 bits: 64 Console: N/A
           Distro: CentOS Linux release 7.6.1810 (Core)
Machine:   Type: Kvm System: Scaleway product: Standard PC (i440FX + PIIX, 1996) v: pc-i440fx-xenial serial: N/A
           Mobo: N/A model: N/A serial: N/A UEFI: EFI Development Kit II / OVMF v: 0.0.0 date: 02/06/2015
CPU:       Single Core: Intel Atom C3955 type: MCP speed: 2100 MHz
Graphics:  Message: No Device data found.
           Display: server: No display server data found. Headless machine? tty: 204x25
           Message: Unable to show advanced data. Required tool glxinfo missing.
Network:   Device-1: Intel 82371AB/EB/MB PIIX4 ACPI type: network bridge driver: piix4_smbus
           Device-2: Red Hat Virtio network driver: virtio-pci
Drives:    Local Storage: total: 23.28 GiB used: 912.6 MiB (3.8%)
Info:      Processes: 66 Uptime: 3m Memory: 988.1 MiB used: 117.4 MiB (11.9%) Init: systemd runlevel: 3 Shell: test.sh
           inxi: 3.0.32

CPU Info:
====================================================
cat /proc/cpuinfo
-----------
processor	: 0
vendor_id	: GenuineIntel
cpu family	: 6
model		: 95
model name	: Intel(R) Atom(TM) CPU C3955 @ 2.10GHz
stepping	: 1
microcode	: 0x1
cpu MHz		: 2100.000
cache size	: 4096 KB
physical id	: 0
siblings	: 1
core id		: 0
cpu cores	: 1
apicid		: 0
initial apicid	: 0
fpu		: yes
fpu_exception	: yes
cpuid level	: 13
wp		: yes
flags		: fpu vme de pse tsc msr pae mce cx8 apic sep mtrr pge mca cmov pat pse36 clflush mmx fxsr sse sse2 ss syscall nx pdpe1gb rdtscp lm constant_tsc arch_perfmon rep_good nopl eagerfpu pni pclmulqdq vmx ssse3 cx16 sse4_1 sse4_2 x2apic movbe popcnt tsc_deadline_timer aes xsave rdrand hypervisor lahf_lm 3dnowprefetch ssbd ibrs ibpb tpr_shadow vnmi flexpriority ept vpid fsgsbase tsc_adjust smep erms mpx rdseed smap clflushopt xsaveopt xsavec xgetbv1 arat spec_ctrl
bogomips	: 4200.00
clflush size	: 64
cache_alignment	: 64
address sizes	: 40 bits physical, 48 bits virtual
power management:


Memory Info:
====================================================
cat /proc/meminfo
-----------
MemTotal:        1011772 kB
MemFree:          443680 kB
MemAvailable:     735116 kB
Buffers:           29856 kB
Cached:           434256 kB
SwapCached:            0 kB
Active:           270672 kB
Inactive:         209100 kB
Active(anon):      15848 kB
Inactive(anon):    12704 kB
Active(file):     254824 kB
Inactive(file):   196396 kB
Unevictable:           0 kB
Mlocked:               0 kB
SwapTotal:             0 kB
SwapFree:              0 kB
Dirty:              1288 kB
Writeback:             0 kB
AnonPages:         15652 kB
Mapped:            13680 kB
Shmem:             12900 kB
Slab:              69252 kB
SReclaimable:      48608 kB
SUnreclaim:        20644 kB
KernelStack:        1120 kB
PageTables:         2320 kB
NFS_Unstable:          0 kB
Bounce:                0 kB
WritebackTmp:          0 kB
CommitLimit:      505884 kB
Committed_AS:      76812 kB
VmallocTotal:   34359738367 kB
VmallocUsed:        4112 kB
VmallocChunk:   34359732208 kB
HardwareCorrupted:     0 kB
AnonHugePages:         0 kB
CmaTotal:              0 kB
CmaFree:               0 kB
HugePages_Total:       0
HugePages_Free:        0
HugePages_Rsvd:        0
HugePages_Surp:        0
Hugepagesize:       2048 kB
DirectMap4k:       52032 kB
DirectMap2M:      993280 kB
DirectMap1G:           0 kB

Disk Info:
====================================================
df -HT
-----------
Filesystem     Type      Size  Used Avail Use% Mounted on
/dev/vda1      ext4      9.7G  954M  8.2G  11% /
devtmpfs       devtmpfs  512M     0  512M   0% /dev
tmpfs          tmpfs     519M     0  519M   0% /dev/shm
tmpfs          tmpfs     519M   14M  505M   3% /run
tmpfs          tmpfs     519M     0  519M   0% /sys/fs/cgroup
/dev/vda15     vfat      104M  3.9M  100M   4% /boot/efi
tmpfs          tmpfs     104M     0  104M   0% /run/user/0

Percona Tools summary:
====================================================
pt-summary
-----------
# Percona Toolkit System Summary Report ######################
        Date | 2019-04-06 20:00:38 UTC (local TZ: UTC +0000)
    Hostname | scw-recursing-mahavira
      Uptime | 3 min,  1 user,  load average: 0.67, 0.46, 0.19
      System | Scaleway; Standard PC (i440FX + PIIX, 1996); vpc-i440fx-xenial (Other)
 Service Tag | Not Specified
    Platform | Linux
     Release | CentOS Linux release 7.6.1810 (Core)
      Kernel | 3.10.0-957.5.1.el7.x86_64
Architecture | CPU = 64-bit, OS = 64-bit
   Threading | NPTL 2.17
     SELinux | Enforcing
 Virtualized | VMWare
# Processor ##################################################
  Processors | physical = 1, cores = 1, virtual = 1, hyperthreading = no
      Speeds | 1x2100.000
      Models | 1xIntel(R) Atom(TM) CPU C3955 @ 2.10GHz
      Caches | 1x4096 KB
# Memory #####################################################
       Total | 988.1M
        Free | 430.4M
        Used | physical = 35.3M, swap allocated = 0.0, swap used = 0.0, virtual = 35.3M
      Shared | 12.6M
     Buffers | 522.4M
      Caches | 716.2M
       Dirty | 1376 kB
     UsedRSS | 59.1M
  Swappiness | 60
 DirtyPolicy | 20, 10
 DirtyStatus | 0, 0
  Locator   Size     Speed             Form Factor   Type          Type Detail
  ========= ======== ================= ============= ============= ===========
  DIMM 0    1024 MB  Unknown           DIMM          RAM           Other
# Mounted Filesystems ########################################
  Filesystem  Size Used Type     Opts                                                                                             Mountpoint
  /dev/vda1   9.0G  11% ext4     rw,relatime,seclabel,data=ordered                                                                /
  /dev/vda15   99M   4% vfat     rw,relatime,fmask=0022,dmask=0022,codepage=437,iocharset=ascii,shortname=mixed,errors=remount-ro /boot/efi
  devtmpfs    488M   0% devtmpfs rw,nosuid,seclabel,size=499108k,nr_inodes=124777,mode=755                                        /dev
  tmpfs        99M   0% tmpfs    rw,nosuid,nodev,seclabel                                                                         /run/user/0
  tmpfs        99M   0% tmpfs    rw,nosuid,nodev,seclabel,mode=755                                                                /run/user/0
  tmpfs        99M   0% tmpfs    rw,nosuid,nodev,relatime,seclabel,size=101180k,mode=700                                          /run/user/0
  tmpfs        99M   0% tmpfs    ro,nosuid,nodev,noexec,seclabel,mode=755                                                         /run/user/0
  tmpfs       495M   0% tmpfs    rw,nosuid,nodev,seclabel                                                                         /dev/shm
  tmpfs       495M   0% tmpfs    rw,nosuid,nodev,seclabel,mode=755                                                                /dev/shm
  tmpfs       495M   0% tmpfs    rw,nosuid,nodev,relatime,seclabel,size=101180k,mode=700                                          /dev/shm
  tmpfs       495M   0% tmpfs    ro,nosuid,nodev,noexec,seclabel,mode=755                                                         /dev/shm
  tmpfs       495M   0% tmpfs    rw,nosuid,nodev,seclabel                                                                         /sys/fs/cgroup
  tmpfs       495M   0% tmpfs    rw,nosuid,nodev,seclabel,mode=755                                                                /sys/fs/cgroup
  tmpfs       495M   0% tmpfs    rw,nosuid,nodev,relatime,seclabel,size=101180k,mode=700                                          /sys/fs/cgroup
  tmpfs       495M   0% tmpfs    ro,nosuid,nodev,noexec,seclabel,mode=755                                                         /sys/fs/cgroup
  tmpfs       495M   3% tmpfs    rw,nosuid,nodev,seclabel                                                                         /run
  tmpfs       495M   3% tmpfs    rw,nosuid,nodev,seclabel,mode=755                                                                /run
  tmpfs       495M   3% tmpfs    rw,nosuid,nodev,relatime,seclabel,size=101180k,mode=700                                          /run
  tmpfs       495M   3% tmpfs    ro,nosuid,nodev,noexec,seclabel,mode=755                                                         /run
# Disk Schedulers And Queue Size #############################
         vda | [mq-deadline] 256
# Disk Partioning ############################################
Device       Type      Start        End               Size
============ ==== ========== ========== ==================
/dev/vda     Disk                              25000000000
/dev/vda1    Part          1   19531249         9999998976
# Kernel Inode State #########################################
dentry-state | 71296	59270	45	0	0	0
     file-nr | 704	0	98428
    inode-nr | 27769	316
# LVM Volumes ################################################
Unable to collect information
# LVM Volume Groups ##########################################
Unable to collect information
# RAID Controller ############################################
  Controller | No RAID controller detected
# Network Config #############################################
  Controller | Red Hat, Inc. Virtio network device
 FIN Timeout | 60
  Port Range | 60999
# Interface Statistics #######################################
  interface  rx_bytes rx_packets  rx_errors   tx_bytes tx_packets  tx_errors
  ========= ========= ========== ========== ========== ========== ==========
  lo                0          0          0          0          0          0
  eth0      100000000      15000          0    1750000      12500          0
# Network Connections ########################################
  Connections from remote IP addresses
    176.116.137.36      1
  Connections to local IP addresses
    10.22.25.157        1
  Connections to top 10 local ports
    22                  1
  States of connections
    ESTABLISHED         1
    LISTEN              3
# Top Processes ##############################################
  PID USER      PR  NI    VIRT    RES    SHR S %CPU %MEM     TIME+ COMMAND
 1029 root      20   0       0      0      0 S  6.2  0.0   0:00.17 jbd2/vda1-8
10127 root      20   0   59620   1956   1452 R  6.2  0.2   0:00.01 top
    1 root      20   0  193452   6604   4168 S  0.0  0.7   0:01.93 systemd
    2 root      20   0       0      0      0 S  0.0  0.0   0:00.00 kthreadd
    3 root      20   0       0      0      0 S  0.0  0.0   0:00.11 ksoftirqd/0
    4 root      20   0       0      0      0 S  0.0  0.0   0:00.00 kworker/0:0
    5 root       0 -20       0      0      0 S  0.0  0.0   0:00.00 kworker/0:0H
    6 root      20   0       0      0      0 S  0.0  0.0   0:00.00 kworker/u2:0
    7 root      rt   0       0      0      0 S  0.0  0.0   0:00.00 migration/0
# Notable Processes ##########################################
  PID    OOM    COMMAND
 2766    -17    sshd
# Memory mamagement ##########################################
Transparent huge pages are enabled.
# The End ####################################################

Starting tests:
====================================================
====================================================

DD:
====================================================
dd if=/dev/zero of=test bs=64k count=16k conv=fdatasync 2>&1
rm -f test
-----------
16384+0 records in
16384+0 records out
1073741824 bytes (1.1 GB) copied, 4.09101 s, 262 MB/s
16384+0 records in
16384+0 records out
1073741824 bytes (1.1 GB) copied, 2.78225 s, 386 MB/s
16384+0 records in
16384+0 records out
1073741824 bytes (1.1 GB) copied, 2.61577 s, 410 MB/s

Sysbench CPU:
====================================================
sysbench cpu --cpu-max-prime=20000 --num-threads=1 run
-----------
sysbench 1.0.17 (using system LuaJIT 2.0.4)

Running the test with following options:
Number of threads: 1
Initializing random number generator from current time


Prime numbers limit: 20000

Initializing worker threads...

Threads started!

CPU speed:
    events per second:   477.00

General statistics:
    total time:                          10.0021s
    total number of events:              4772

Latency (ms):
         min:                                    2.08
         avg:                                    2.09
         max:                                    2.31
         95th percentile:                        2.11
         sum:                                 9995.51

Threads fairness:
    events (avg/stddev):           4772.0000/0.00
    execution time (avg/stddev):   9.9955/0.00


Sysbench CPU Mutex 64:
====================================================
sysbench mutex --threads=64 run
-----------
sysbench 1.0.17 (using system LuaJIT 2.0.4)

Running the test with following options:
Number of threads: 64
Initializing random number generator from current time


Initializing worker threads...

Threads started!


General statistics:
    total time:                          14.0049s
    total number of events:              64

Latency (ms):
         min:                                13833.81
         avg:                                13932.59
         max:                                13986.40
         95th percentile:                    14047.70
         sum:                               891685.87

Threads fairness:
    events (avg/stddev):           1.0000/0.00
    execution time (avg/stddev):   13.9326/0.03


Memory size for Sysbench Memory test: 1G
Disk space for Sysbench Disk test: 2G
Sysbench Memory test:
====================================================
sysbench memory --num-threads=4 --memory-total-size=1G run
-----------
WARNING: --num-threads is deprecated, use --threads instead
sysbench 1.0.17 (using system LuaJIT 2.0.4)

Running the test with following options:
Number of threads: 4
Initializing random number generator from current time


Running memory speed test with the following options:
  block size: 1KiB
  total size: 1024MiB
  operation: write
  scope: global

Initializing worker threads...

Threads started!

Total operations: 1048576 (2721223.80 per second)

1024.00 MiB transferred (2657.45 MiB/sec)


General statistics:
    total time:                          0.3834s
    total number of events:              1048576

Latency (ms):
         min:                                    0.00
         avg:                                    0.00
         max:                                    8.02
         95th percentile:                        0.00
         sum:                                  666.72

Threads fairness:
    events (avg/stddev):           262144.0000/0.00
    execution time (avg/stddev):   0.1667/0.01


Sysbench Disk test:
====================================================
sysbench fileio --file-total-size=2G prepare
-----------
sysbench 1.0.17 (using system LuaJIT 2.0.4)

128 files, 16384Kb each, 2048Mb total
Creating files for the test...
Extra file open flags: (none)
Creating file test_file.0
...
Creating file test_file.127
2147483648 bytes written in 9.32 seconds (219.65 MiB/sec).
sysbench fileio --file-total-size=2G --file-test-mode=rndrw --time=300 --max-requests=0 run
-----------
sysbench 1.0.17 (using system LuaJIT 2.0.4)

Running the test with following options:
Number of threads: 1
Initializing random number generator from current time


Extra file open flags: (none)
128 files, 16MiB each
2GiB total file size
Block size 16KiB
Number of IO requests: 0
Read/Write ratio for combined random IO test: 1.50
Periodic FSYNC enabled, calling fsync() each 100 requests.
Calling fsync() at the end of test, Enabled.
Using synchronous I/O mode
Doing random r/w test
Initializing worker threads...

Threads started!


File operations:
    reads/s:                      335.99
    writes/s:                     223.99
    fsyncs/s:                     716.84

Throughput:
    read, MiB/s:                  5.25
    written, MiB/s:               3.50

General statistics:
    total time:                          300.1895s
    total number of events:              383160

Latency (ms):
         min:                                    0.01
         avg:                                    0.78
         max:                                   20.44
         95th percentile:                        4.18
         sum:                               299320.32

Threads fairness:
    events (avg/stddev):           383160.0000/0.00
    execution time (avg/stddev):   299.3203/0.00


Speedtest cli:
====================================================
speedtest-cli
-----------
Retrieving speedtest.net configuration...
Testing from Scaleway (51.15.89.241)...
Retrieving speedtest.net server list...
Selecting best server based on ping...
Hosted by SFR SAS (Paris) [1.88 km]: 13.23 ms
Testing download speed................................................................................
Download: 1195.80 Mbit/s
Testing upload speed....................................................................................................
Upload: 326.19 Mbit/s

7-zip benchmark:
====================================================
7za b
-----------

7-Zip (a) [64] 16.02 : Copyright (c) 1999-2016 Igor Pavlov : 2016-05-21
p7zip Version 16.02 (locale=C,Utf16=off,HugeFiles=on,64 bits,1 CPU Intel(R) Atom(TM) CPU C3955 @ 2.10GHz (506F1),ASM,AES-NI)

Intel(R) Atom(TM) CPU C3955 @ 2.10GHz (506F1)
CPU Freq:  2361  2362  2368  2363  2365  2366  2369  2363  2366

RAM size:     988 MB,  # CPU hardware threads:   1
RAM usage:    435 MB,  # Benchmark threads:      1

                       Compressing  |                  Decompressing
Dict     Speed Usage    R/U Rating  |      Speed Usage    R/U Rating
         KiB/s     %   MIPS   MIPS  |      KiB/s     %   MIPS   MIPS

22:       1938   100   1891   1886  |      26908   100   2297   2297
23:       1765   100   1801   1799  |      26297   100   2283   2276
24:       1623   100   1749   1746  |      25736   100   2262   2259
25:       1415   100   1619   1616  |      25158   100   2248   2239
----------------------------------  | ------------------------------
Avr:             100   1765   1762  |              100   2272   2268
Tot:             100   2019   2015
Выводы
Развертывать какой-то продакшн тут я наверное не буду, но для dev-серверов в принципе неплохое предложение. По стоимости практически такое же как у Hetzner Cloud.