![]()
Привет!
Затестил новые виртуалки от VDSina. На этот раз это VDS с процессором AMD Epyc. Обычно я беру виртуалки на процессорах Intel. Посмотрим теперь на AMD =)
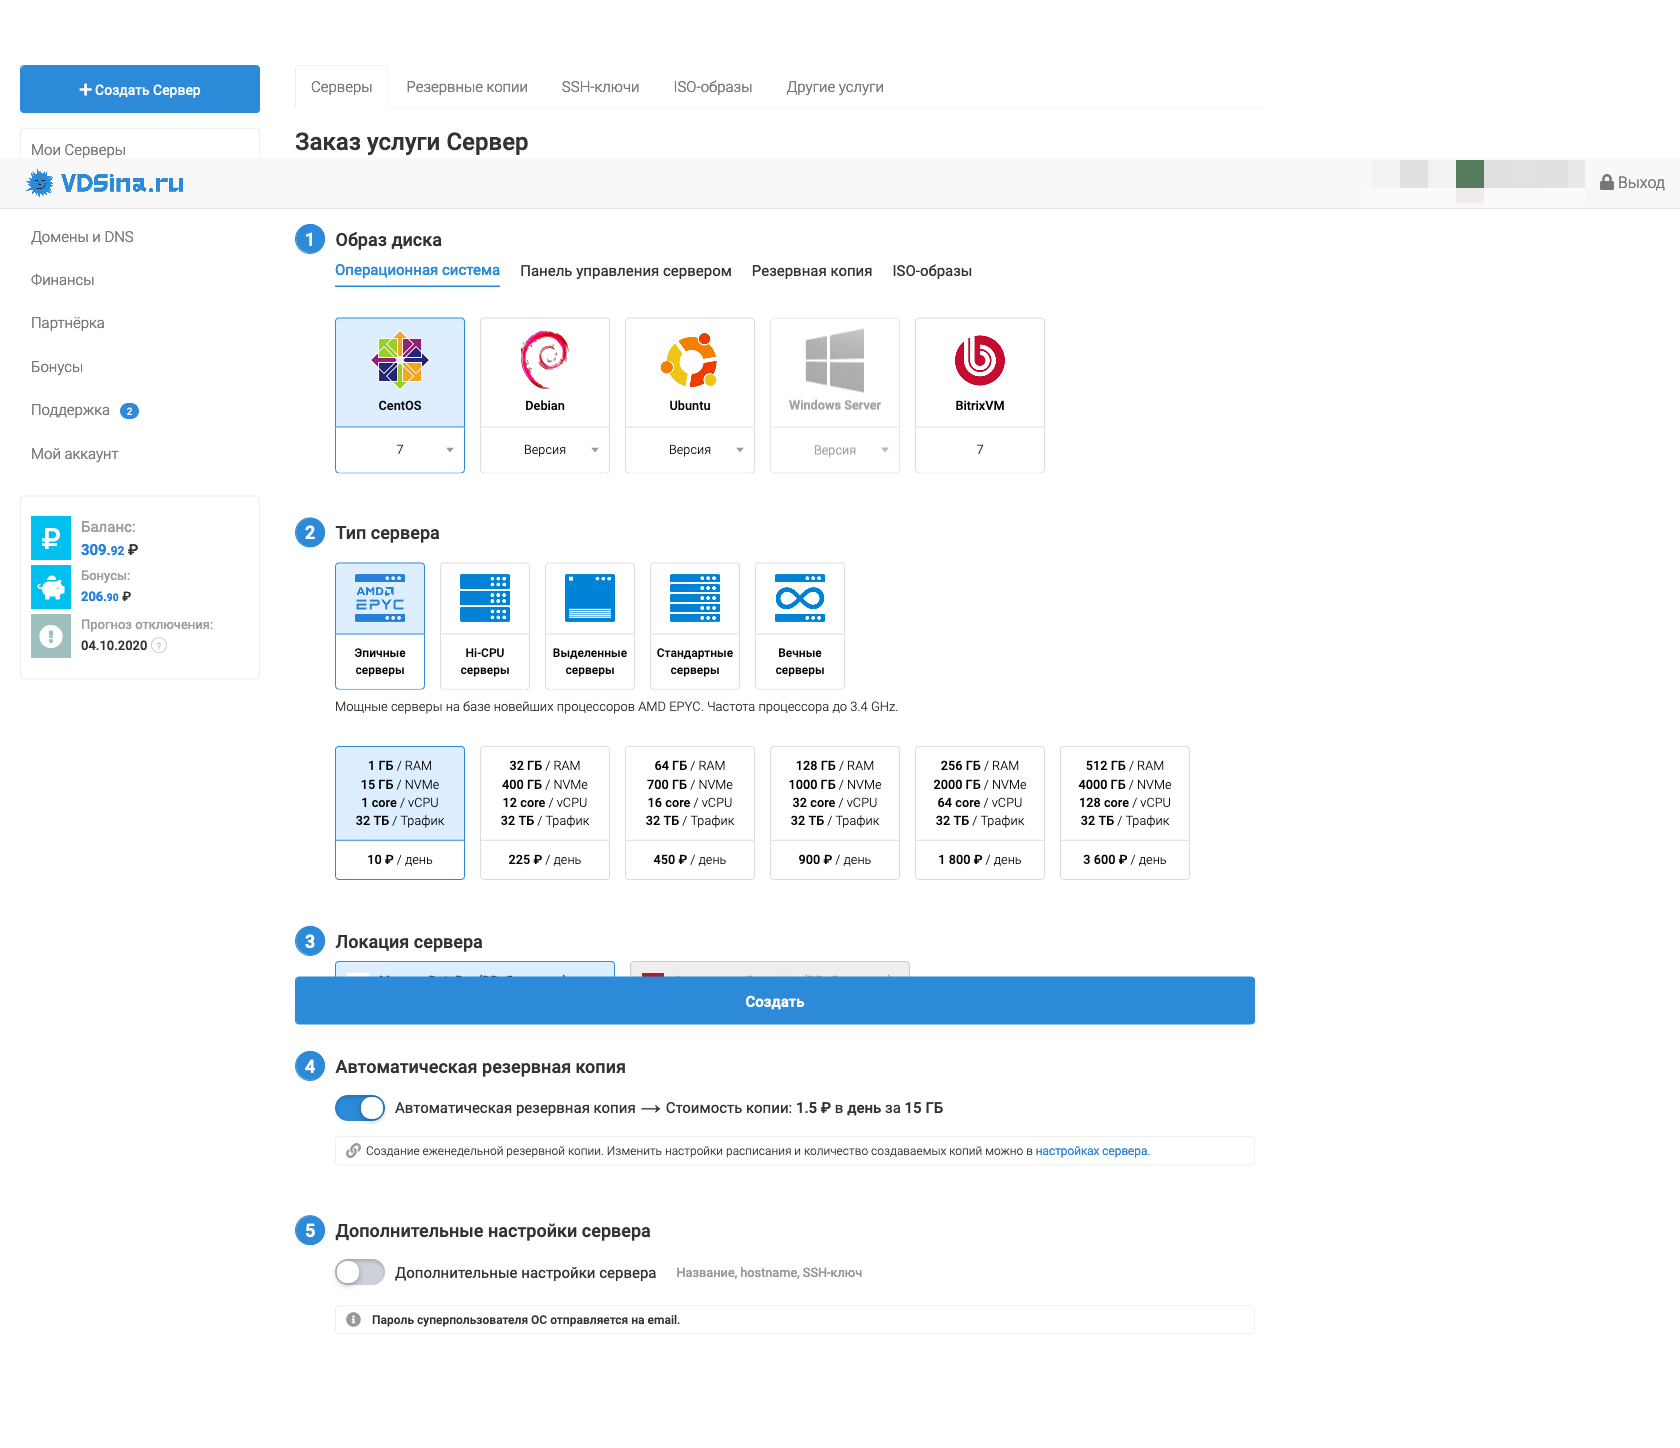
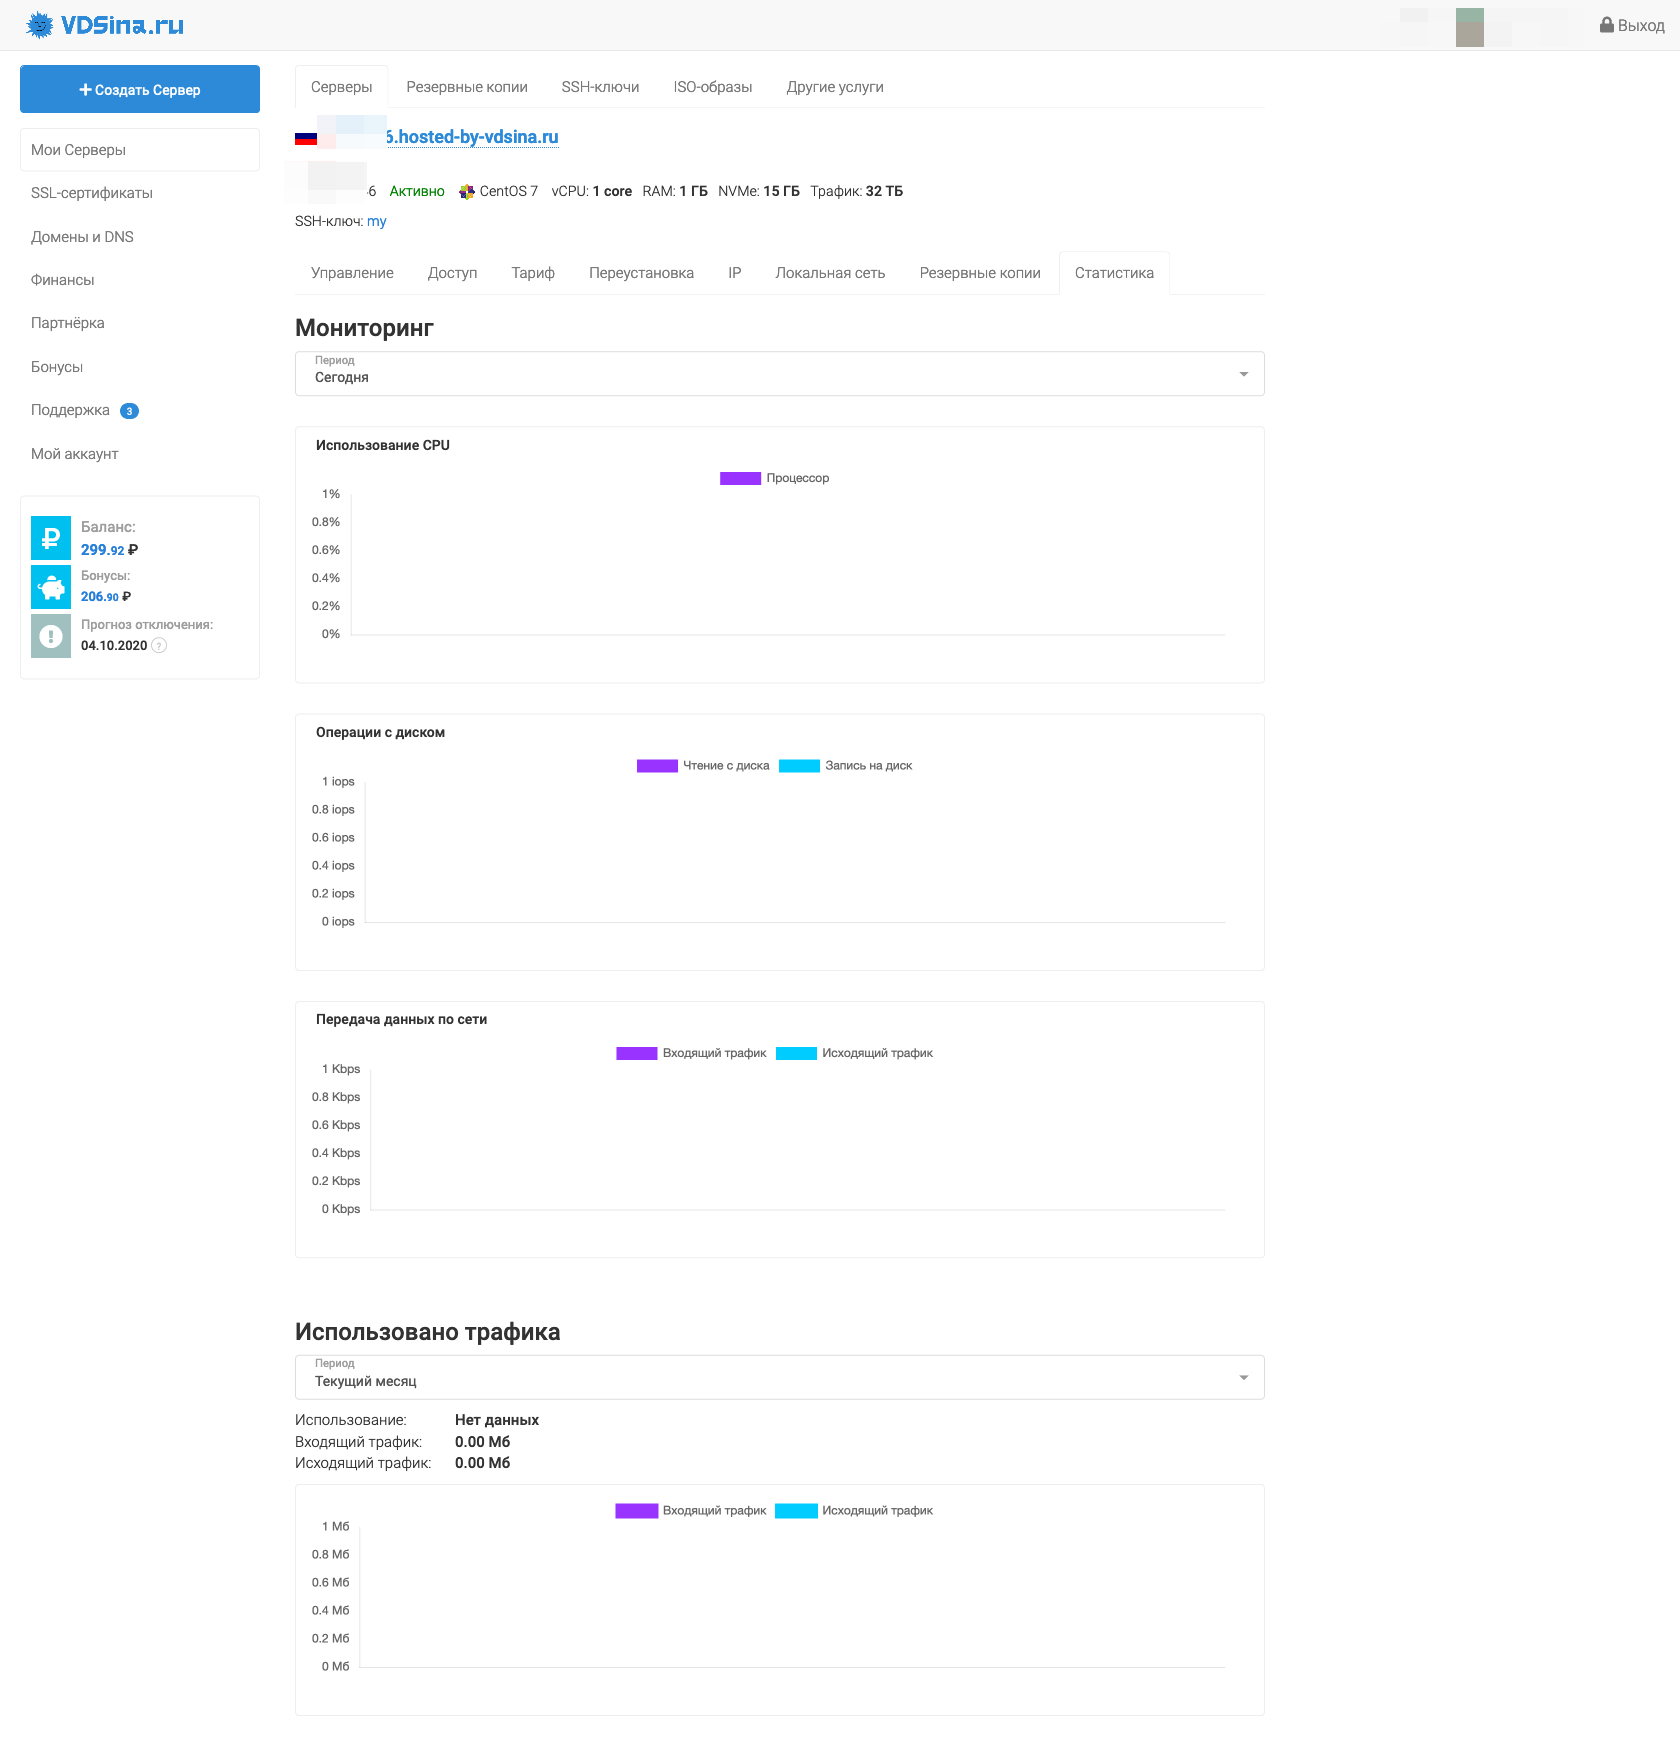
Панель управления сервером в VDSina
Если сравнивать с функционалом панели образца 2018 года то есть небольшие изменения. Но в целом все точно такое же.
Пункты с изменениями
Новые тарифы и образы ОС
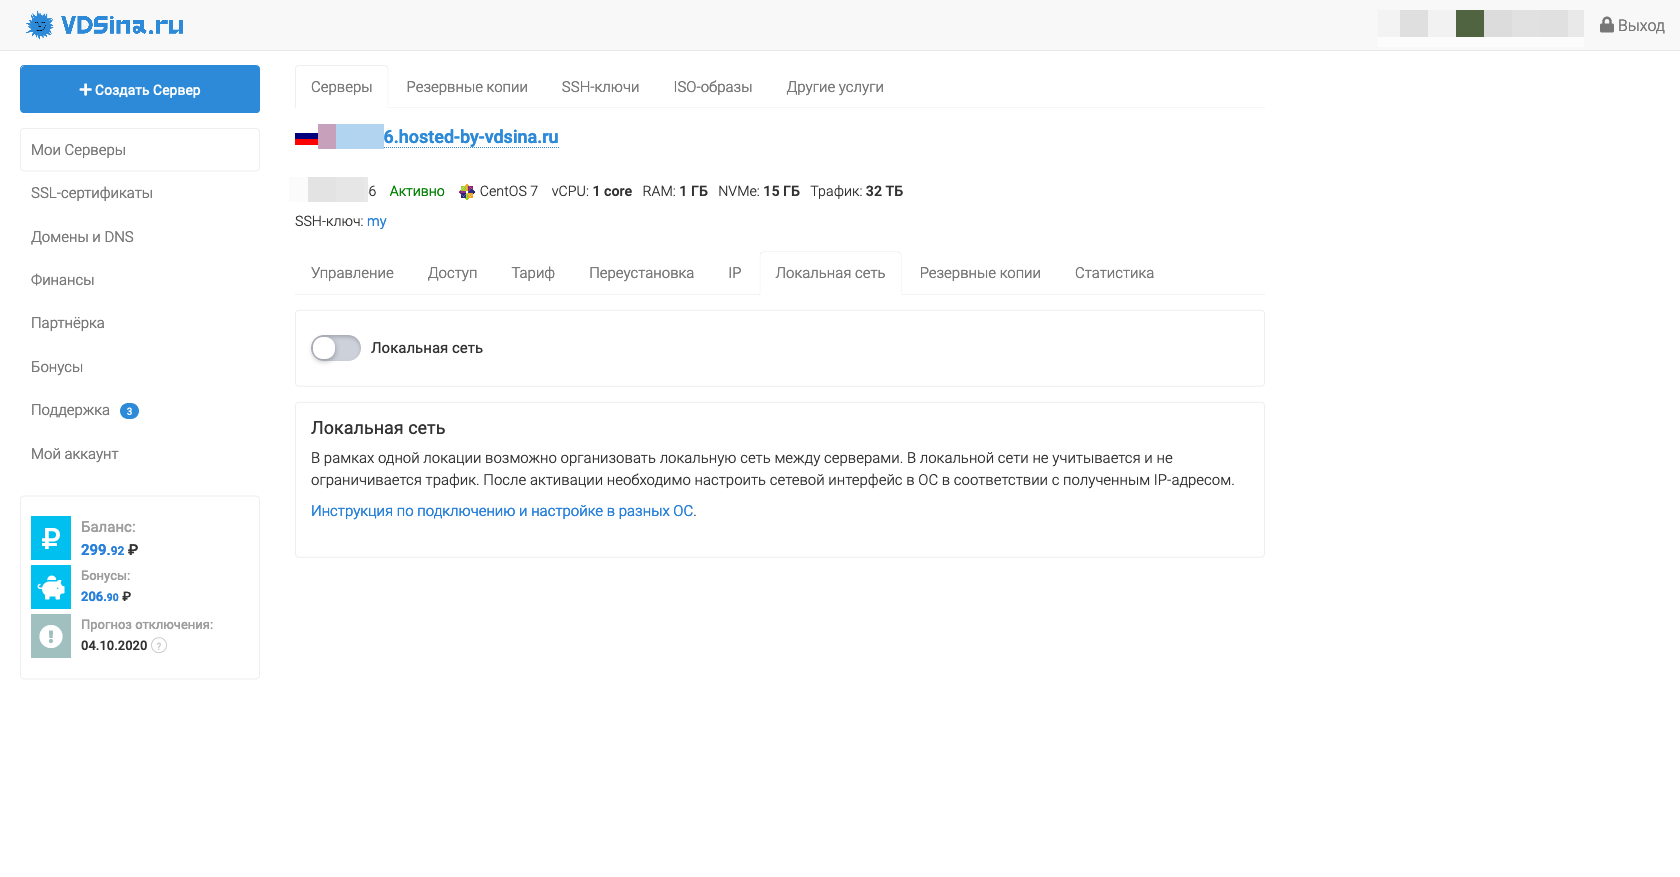
Появилась возможность настраивать локальную сеть между серверами.
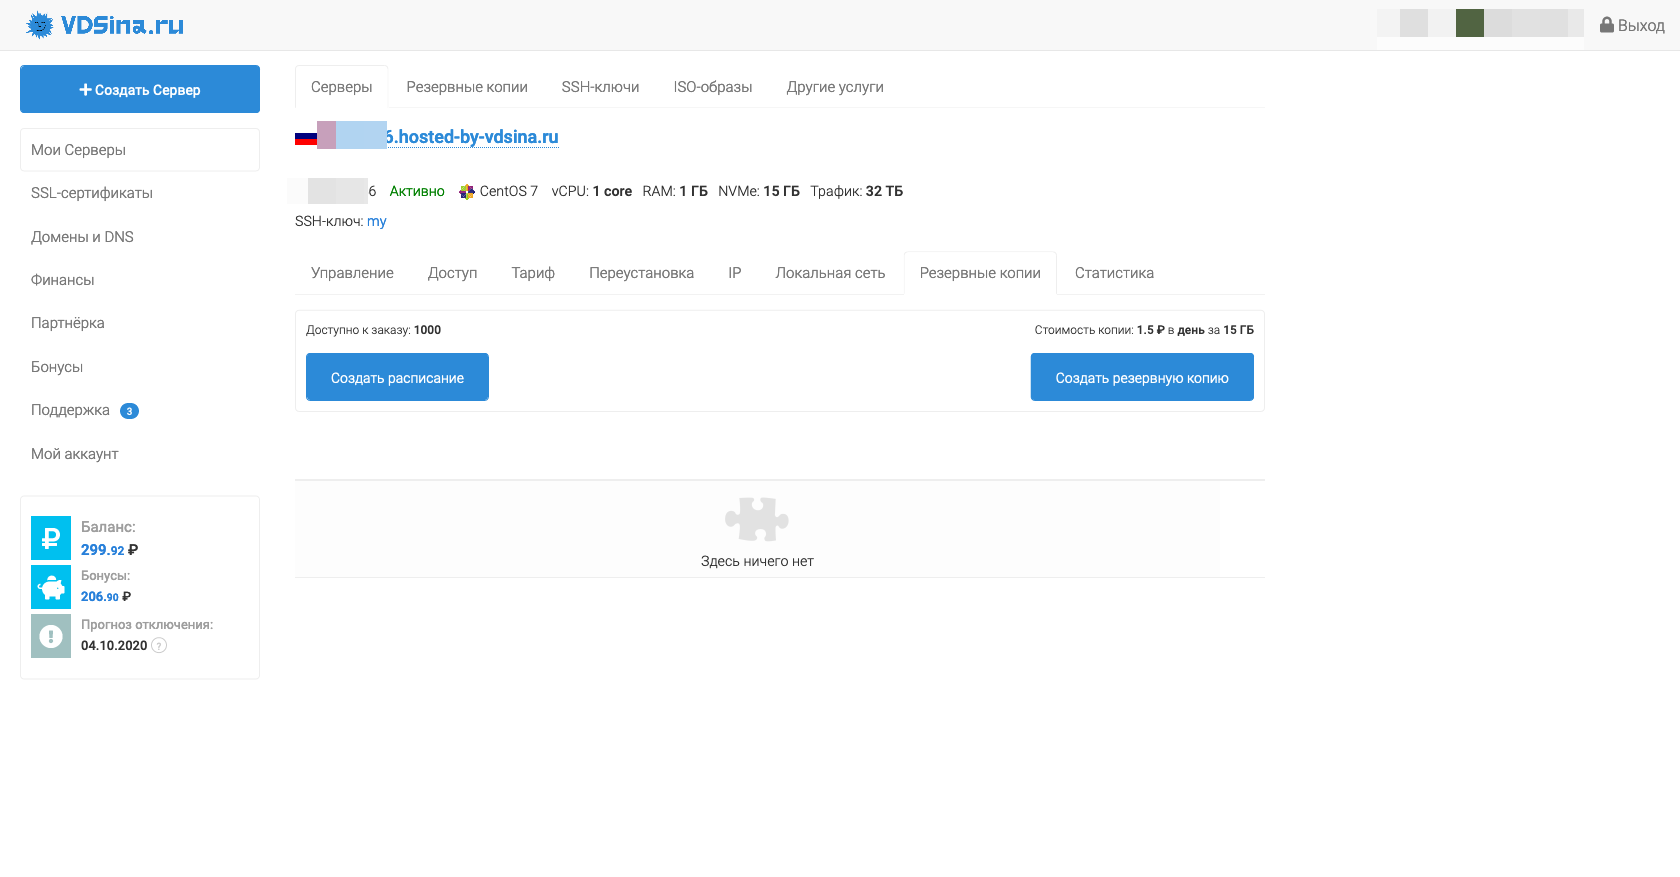
Вместо “Снимков” за 15 рублей/день теперь можно создавать до 1000 резервных копий по 1,5 рубля в день за 15 гигабайтный диск.
Пункты без изменений.
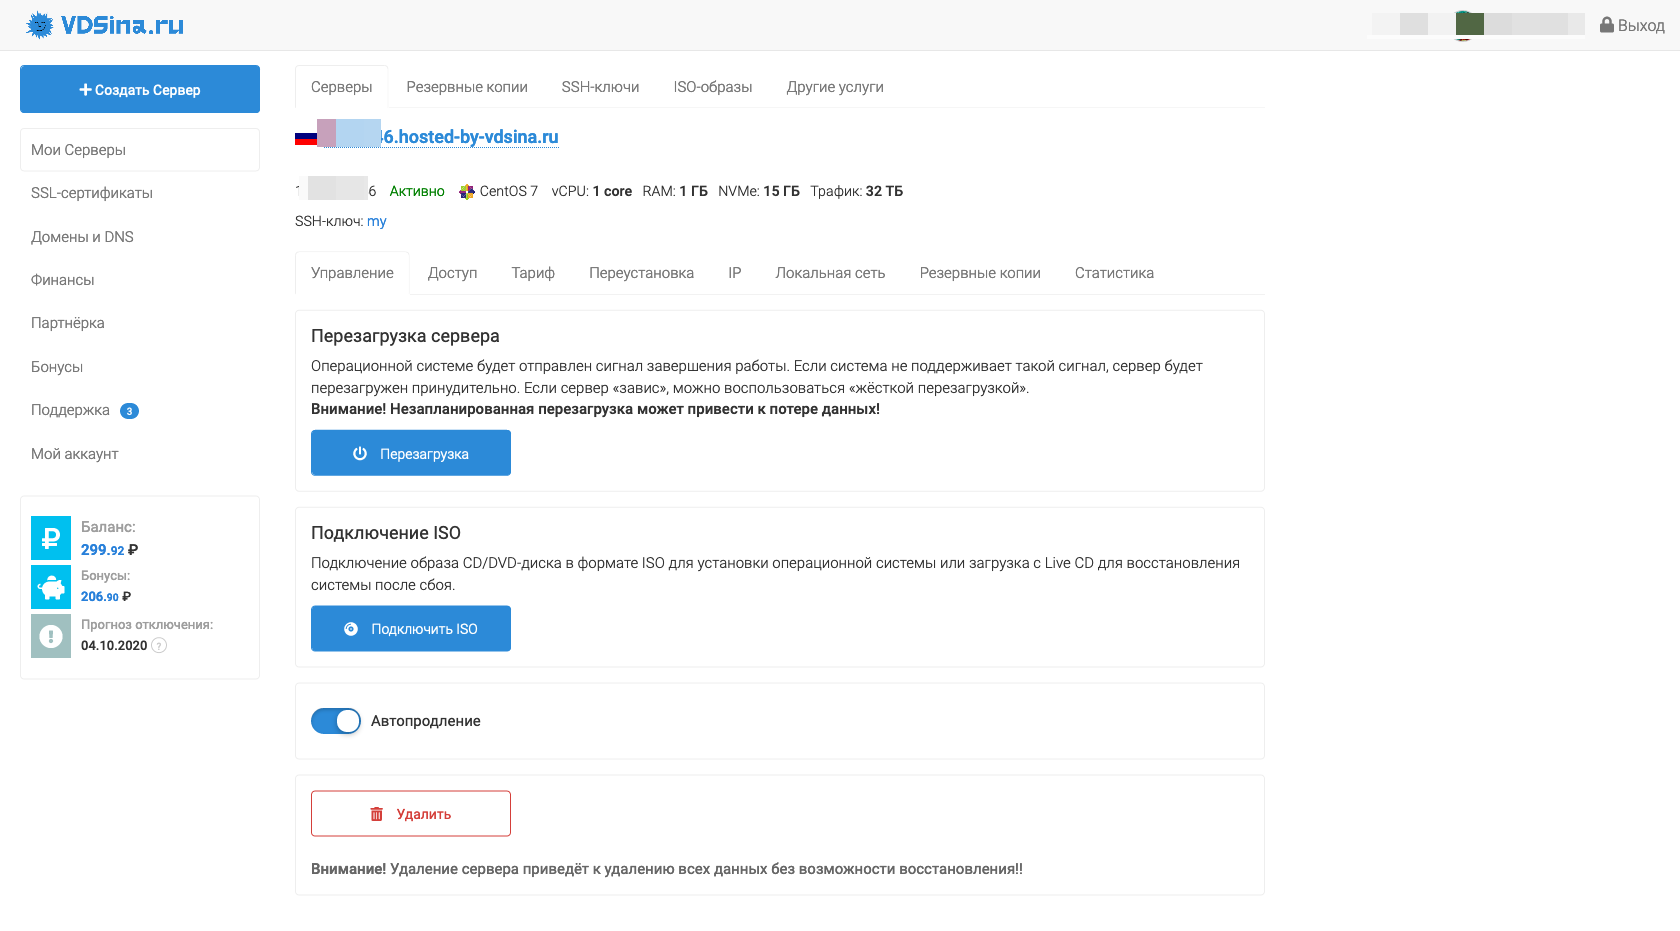
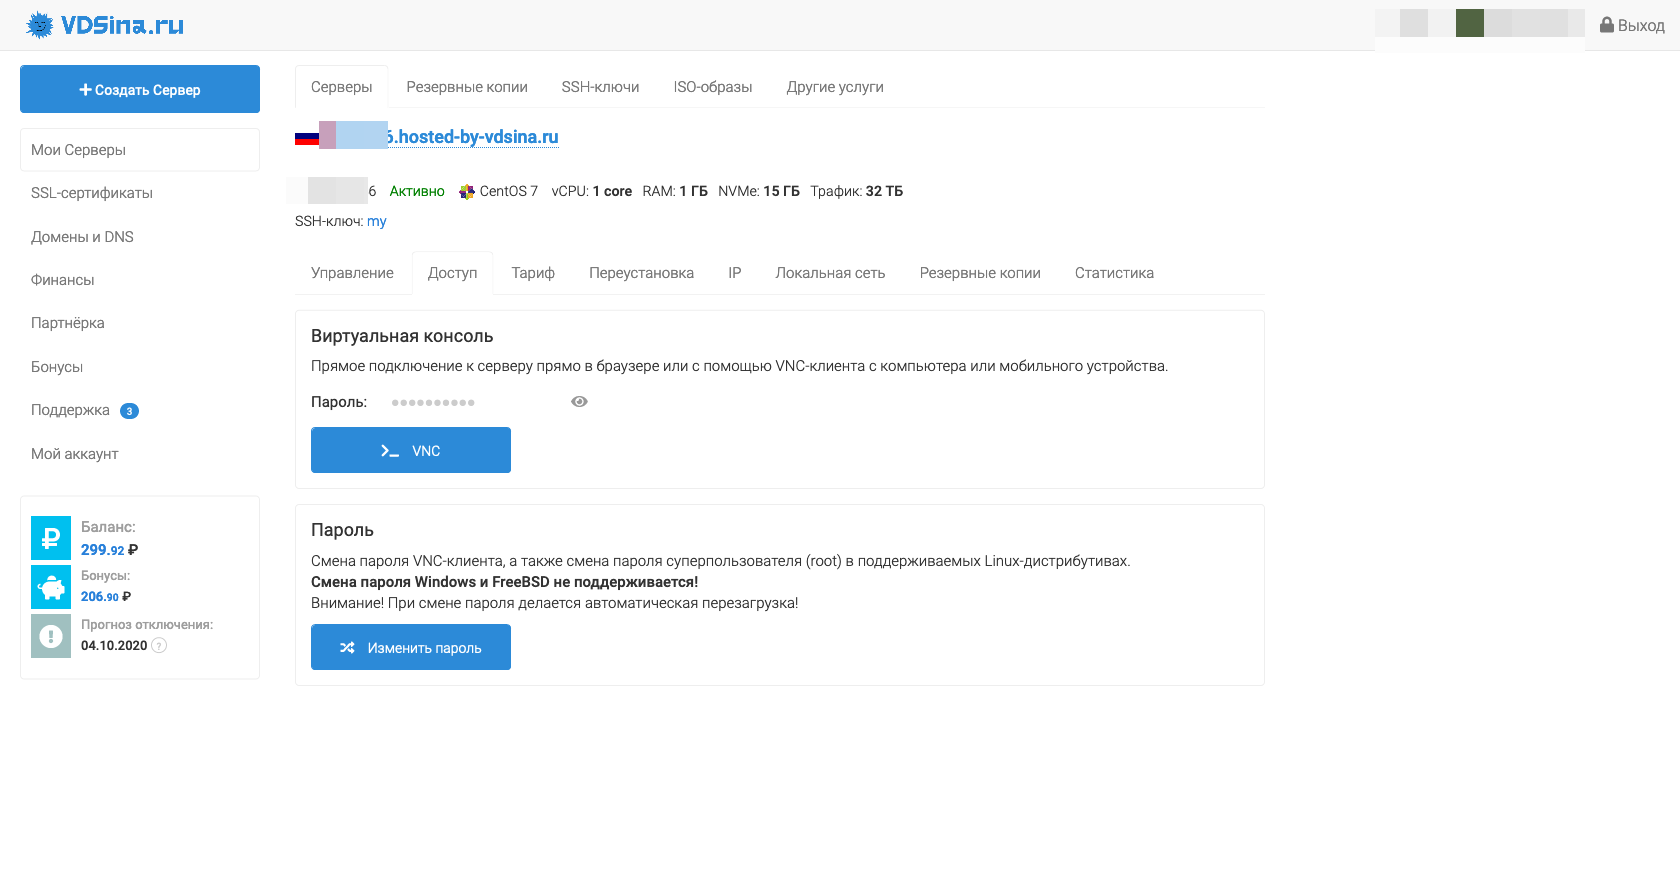
Управление сервером
Смена пароля и VNC-доступ
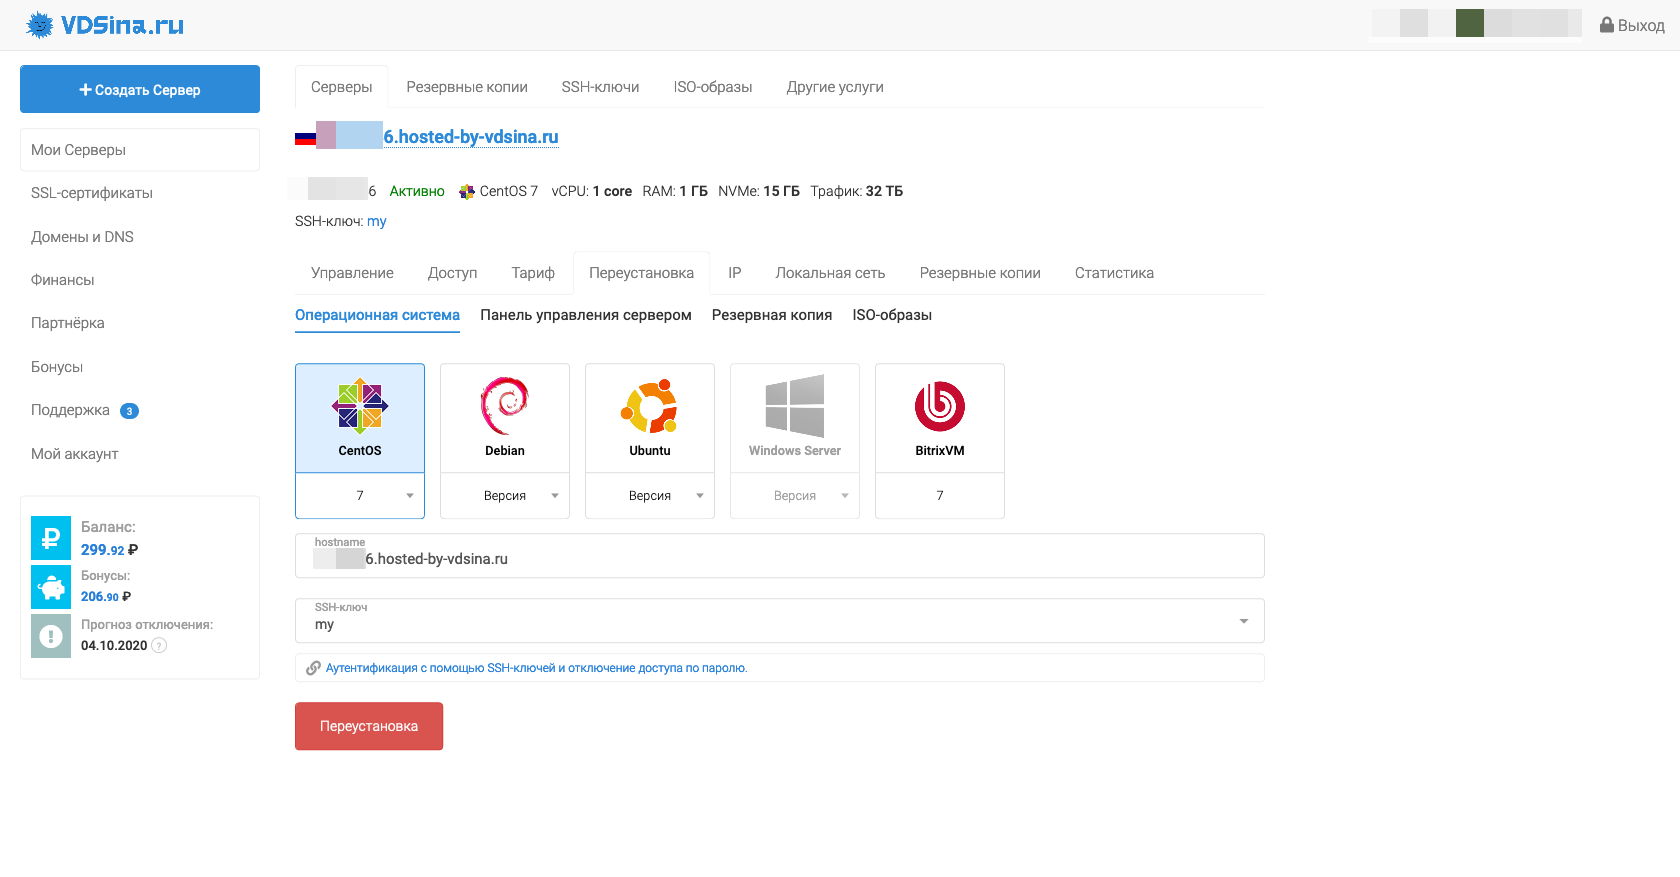
Переустановка ОС
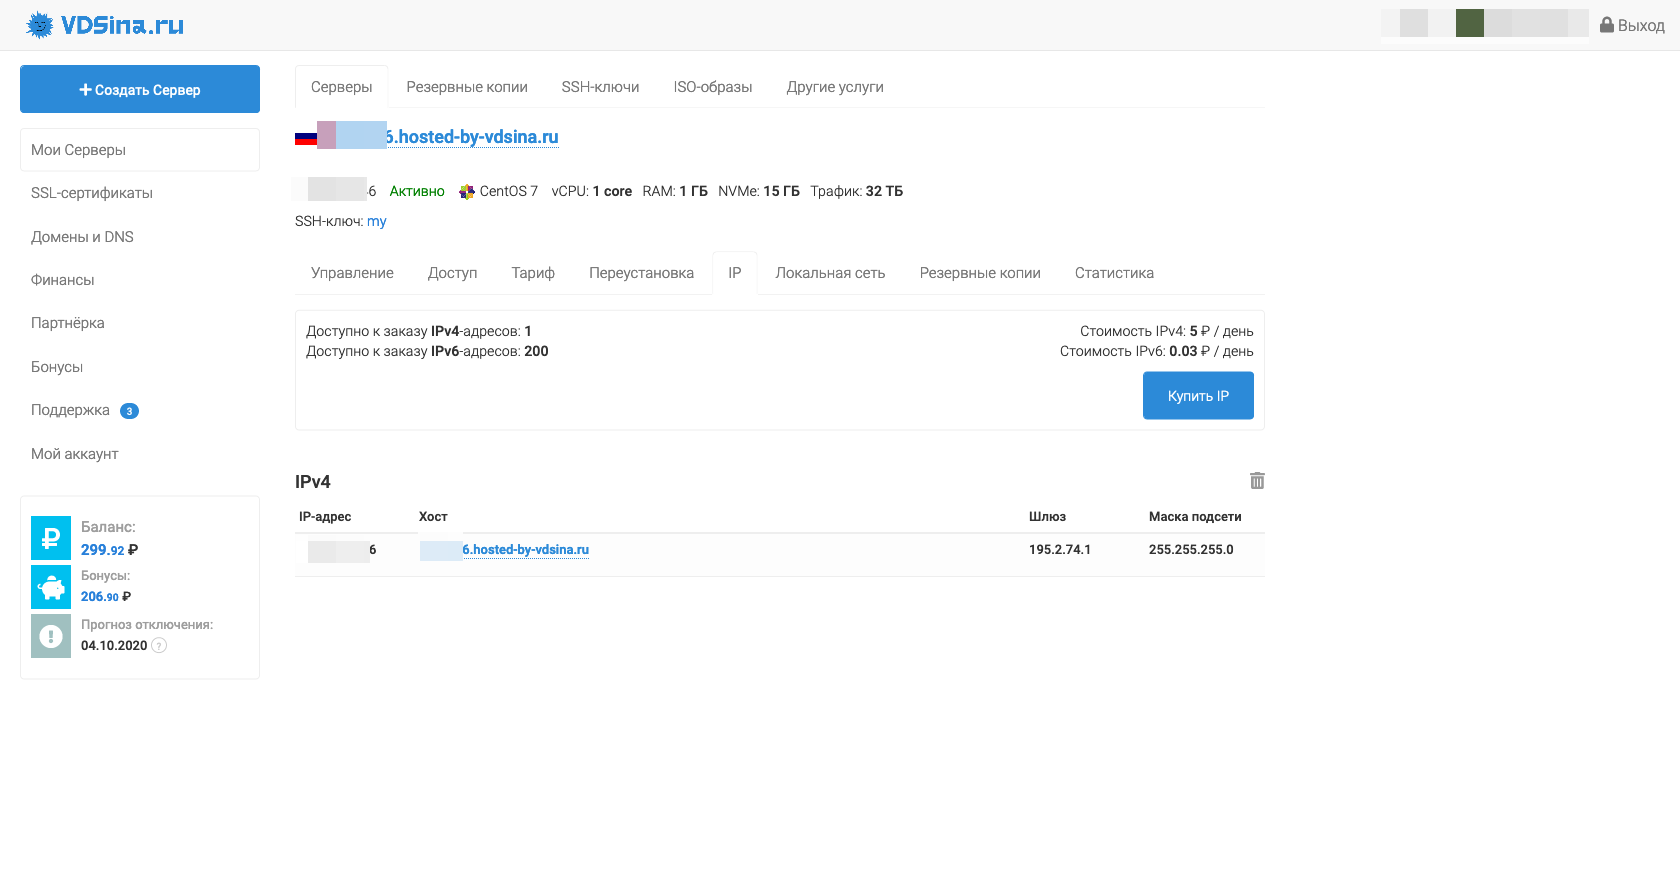
Заказ дополнительных IP
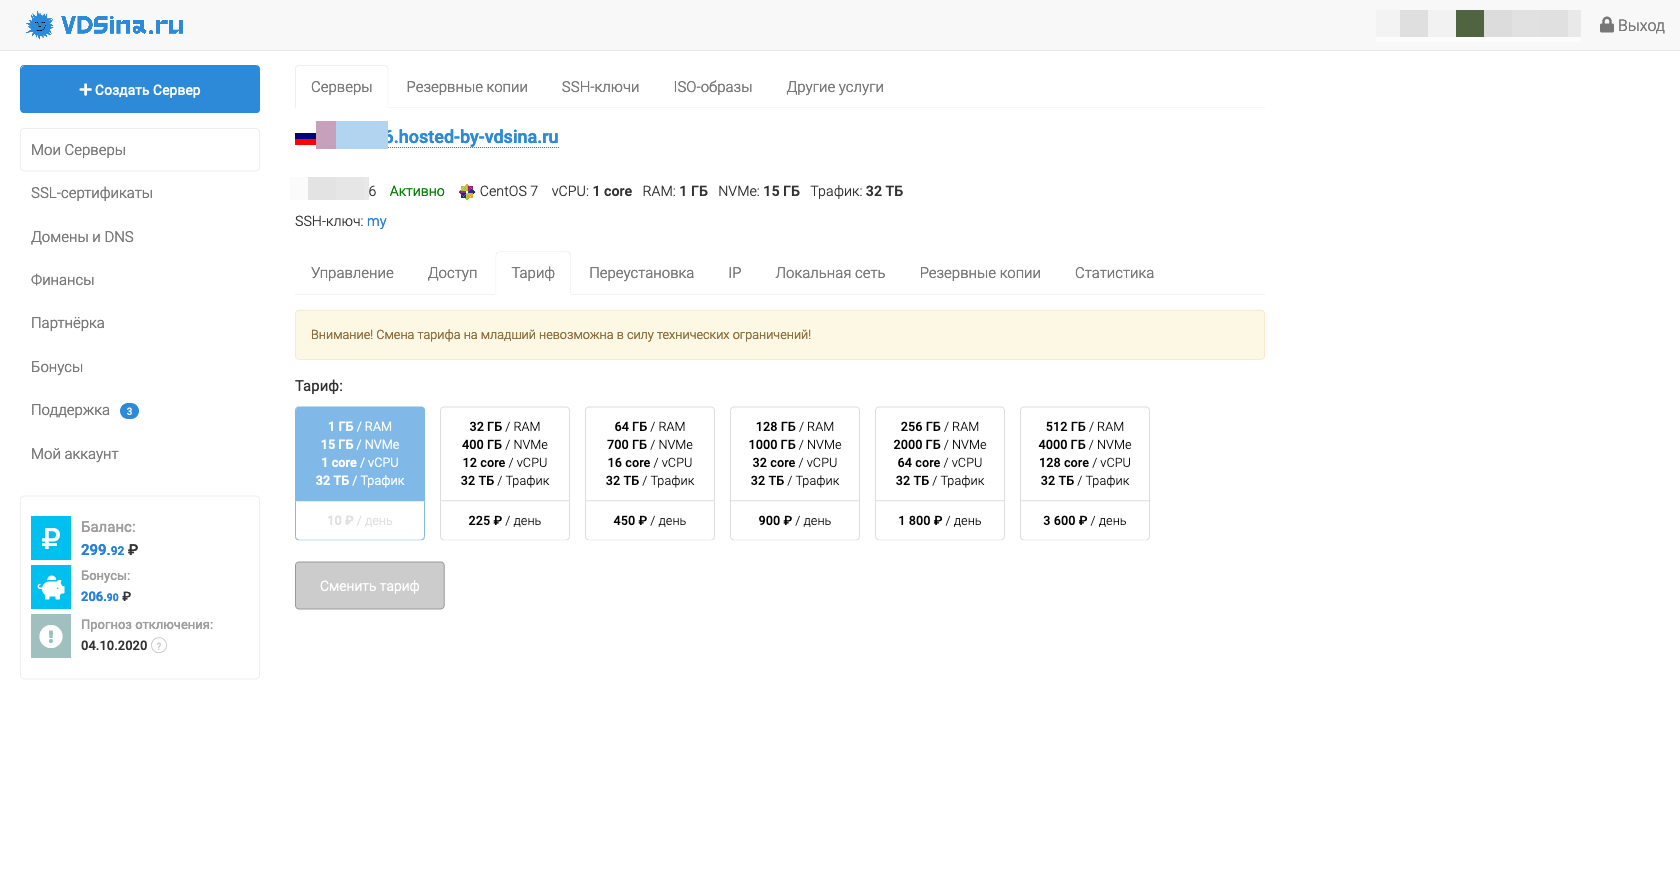
Можно переключить тариф, но только в бОльшую сторону.
Панель мониторинга нагрузки не изменилась.
Сведения о VM
На сервере установлена CentOS 7.8
cat /etc/centos-release
-----------
CentOS Linux release 7.8.2003 (Core)

Kernel info:
====================================================
uname -a
-----------
Linux v332446.hosted-by-vdsina.ru 3.10.0-1062.4.1.el7.x86_64 #1 SMP Fri Oct 18 17:15:30 UTC 2019 x86_64 x86_64 x86_64 GNU/Linux
Inxi
inxi -b
-----------
System:    Host: v332446.hosted-by-vdsina.ru Kernel: 3.10.0-1062.4.1.el7.x86_64 x86_64 bits: 64 Console: N/A
           Distro: CentOS Linux release 7.8.2003 (Core)
Machine:   Type: Microsoft System: Red Hat product: KVM v: RHEL 7.6.0 PC (i440FX + PIIX, 1996) serial: N/A
           Mobo: N/A model: N/A serial: N/A BIOS: SeaBIOS v: 1.11.0-2.el7 date: 04/01/2014
CPU:       Single Core: Common KVM type: UP speed: 2250 MHz
Graphics:  Device-1: driver: bochs-drm v: N/A
           Display: server: No display server data found. Headless machine? tty: 208x24
           Message: Unable to show advanced data. Required tool glxinfo missing.
Network:   Device-1: Intel 82371AB/EB/MB PIIX4 ACPI type: network bridge driver: piix4_smbus
           Device-2: Red Hat Virtio network driver: virtio-pci
Drives:    Local Storage: total: 15.00 GiB used: 1.78 GiB (11.9%)
Info:      Processes: 70 Uptime: 7m Memory: 991.0 MiB used: 180.5 MiB (18.2%) Init: systemd runlevel: 3 Shell: clstr_test.sh
           inxi: 3.1.03
PT Summary
pt-summary
-----------
# Percona Toolkit System Summary Report ######################
        Date | 2020-09-04 10:40:30 UTC (local TZ: MSK +0300)
    Hostname | v33xxx6.hosted-by-vdsina.ru
      Uptime | 7 min,  1 user,  load average: 0.47, 0.89, 0.46
      System | Red Hat; KVM; vRHEL 7.6.0 PC (i440FX + PIIX, 1996) (Other)
 Service Tag | Not Specified
    Platform | Linux
     Release | CentOS Linux release 7.8.2003 (Core)
      Kernel | 3.10.0-1062.4.1.el7.x86_64
Architecture | CPU = 64-bit, OS = 64-bit
   Threading | NPTL 2.17
     SELinux | Disabled
 Virtualized | VMWare
# Processor ##################################################
  Processors | physical = 1, cores = 1, virtual = 1, hyperthreading = no
      Speeds | 1x2249.998
      Models | 1xCommon KVM processor
      Caches | 1x512 KB
# Memory #####################################################
       Total | 991.0M
        Free | 153.9M
        Used | physical = 92.6M, swap allocated = 0.0, swap used = 0.0, virtual = 92.6M
      Shared | 6.6M
     Buffers | 744.5M
      Caches | 730.8M
       Dirty | 108 kB
     UsedRSS | 129.3M
  Swappiness | 30
 DirtyPolicy | 30, 10
 DirtyStatus | 0, 0
  Locator   Size     Speed             Form Factor   Type          Type Detail
  ========= ======== ================= ============= ============= ===========
  DIMM 0    1024 MB  Unknown           DIMM          RAM           Other
# Mounted Filesystems ########################################
  Filesystem  Size Used Type     Opts                                             Mountpoint
  devtmpfs    485M   0% devtmpfs rw,nosuid,size=495856k,nr_inodes=123964,mode=755 /dev
  /dev/vda1    15G  13% ext4     rw,relatime,data=ordered                         /
  tmpfs       100M   0% tmpfs    rw,nosuid,nodev                                  /run/user/0
  tmpfs       100M   0% tmpfs    rw,nosuid,nodev,mode=755                         /run/user/0
  tmpfs       100M   0% tmpfs    rw,nosuid,nodev,relatime,size=101476k,mode=700   /run/user/0
  tmpfs       100M   0% tmpfs    ro,nosuid,nodev,noexec,mode=755                  /run/user/0
  tmpfs       496M   0% tmpfs    rw,nosuid,nodev                                  /dev/shm
  tmpfs       496M   0% tmpfs    rw,nosuid,nodev,mode=755                         /dev/shm
  tmpfs       496M   0% tmpfs    rw,nosuid,nodev,relatime,size=101476k,mode=700   /dev/shm
  tmpfs       496M   0% tmpfs    ro,nosuid,nodev,noexec,mode=755                  /dev/shm
  tmpfs       496M   0% tmpfs    rw,nosuid,nodev                                  /sys/fs/cgroup
  tmpfs       496M   0% tmpfs    rw,nosuid,nodev,mode=755                         /sys/fs/cgroup
  tmpfs       496M   0% tmpfs    rw,nosuid,nodev,relatime,size=101476k,mode=700   /sys/fs/cgroup
  tmpfs       496M   0% tmpfs    ro,nosuid,nodev,noexec,mode=755                  /sys/fs/cgroup
  tmpfs       496M   2% tmpfs    rw,nosuid,nodev                                  /run
  tmpfs       496M   2% tmpfs    rw,nosuid,nodev,mode=755                         /run
  tmpfs       496M   2% tmpfs    rw,nosuid,nodev,relatime,size=101476k,mode=700   /run
  tmpfs       496M   2% tmpfs    ro,nosuid,nodev,noexec,mode=755                  /run
# Disk Schedulers And Queue Size #############################
         vda | [mq-deadline] 256
# Disk Partioning ############################################
Device       Type      Start        End               Size
============ ==== ========== ========== ==================
/dev/vda     Disk                              16106127360
/dev/vda1    Part       2048   31457279        16105078272
# Kernel Inode State #########################################
dentry-state | 76213	66073	45	0	44121	0
     file-nr | 1024	0	97846
    inode-nr | 41174	17117
# LVM Volumes ################################################
Unable to collect information
# LVM Volume Groups ##########################################
Unable to collect information
# RAID Controller ############################################
  Controller | No RAID controller detected
# Network Config #############################################
  Controller | Red Hat, Inc. Virtio network device
 FIN Timeout | 60
  Port Range | 60999
# Interface Statistics #######################################
  interface  rx_bytes rx_packets  rx_errors   tx_bytes tx_packets  tx_errors
  ========= ========= ========== ========== ========== ========== ==========
  lo             6000         60          0       6000         60          0
  eth0      350000000      50000          0    4500000      35000          0
# Network Devices ############################################
  Device    Speed     Duplex
  ========= ========= =========
  eth0
# Top Processes ##############################################
  PID USER      PR  NI    VIRT    RES    SHR S %CPU %MEM     TIME+ COMMAND
    1 root      20   0   43488   3732   2412 S  0.0  0.4   0:01.44 systemd
    2 root      20   0       0      0      0 S  0.0  0.0   0:00.00 kthreadd
    4 root       0 -20       0      0      0 S  0.0  0.0   0:00.00 kworker/0:0H
    5 root      20   0       0      0      0 S  0.0  0.0   0:00.27 kworker/u2:0
    6 root      20   0       0      0      0 S  0.0  0.0   0:00.14 ksoftirqd/0
    7 root      rt   0       0      0      0 S  0.0  0.0   0:00.00 migration/0
    8 root      20   0       0      0      0 S  0.0  0.0   0:00.00 rcu_bh
    9 root      20   0       0      0      0 S  0.0  0.0   0:00.72 rcu_sched
   10 root       0 -20       0      0      0 S  0.0  0.0   0:00.00 lru-add-dra+
# Notable Processes ##########################################
  PID    OOM    COMMAND
  874    -17    sshd
# Memory mamagement ##########################################
Transparent huge pages are enabled.
# The End ####################################################
Частота процессора тут выше чем в тесте 2018 года.
Тесты
Диск
DD
dd if=/dev/zero of=test bs=64k count=16k conv=fdatasync 2>&1
rm -f test
-----------
16384+0 records in
16384+0 records out
1073741824 bytes (1.1 GB) copied, 1.31386 s, 817 MB/s
16384+0 records in
16384+0 records out
1073741824 bytes (1.1 GB) copied, 1.56544 s, 686 MB/s
16384+0 records in
16384+0 records out
1073741824 bytes (1.1 GB) copied, 1.42632 s, 753 MB/s
Скорость диска при линейном копировании ниже на 30%.
Sysbench тест диска
Подготавливаем тестовые файлы.
sysbench fileio --file-total-size=2G prepare
-----------
sysbench 1.0.17 (using system LuaJIT 2.0.4)

128 files, 16384Kb each, 2048Mb total
Creating files for the test...
Extra file open flags: (none)
Creating file test_file.0
...
Creating file test_file.127
2147483648 bytes written in 11.37 seconds (180.12 MiB/sec).
Запускаем тест
sysbench fileio --file-total-size=2G --file-test-mode=rndrw --time=300 --max-requests=0 run
-----------
sysbench 1.0.17 (using system LuaJIT 2.0.4)

Running the test with following options:
Number of threads: 1
Initializing random number generator from current time


Extra file open flags: (none)
128 files, 16MiB each
2GiB total file size
Block size 16KiB
Number of IO requests: 0
Read/Write ratio for combined random IO test: 1.50
Periodic FSYNC enabled, calling fsync() each 100 requests.
Calling fsync() at the end of test, Enabled.
Using synchronous I/O mode
Doing random r/w test
Initializing worker threads...

Threads started!


File operations:
    reads/s:                      265.43
    writes/s:                     176.95
    fsyncs/s:                     566.25

Throughput:
    read, MiB/s:                  4.15
    written, MiB/s:               2.76

General statistics:
    total time:                          300.1481s
    total number of events:              302658

Latency (ms):
         min:                                    0.00
         avg:                                    0.99
         max:                                  231.42
         95th percentile:                        3.43
         sum:                               299403.74

Threads fairness:
    events (avg/stddev):           302658.0000/0.00
    execution time (avg/stddev):   299.4037/0.00
На тесте sysbench диск показал себя в разы хуже чем на тесте 2018 года =(
Процессор
Sysbench CPU:
====================================================
sysbench cpu --cpu-max-prime=20000 --num-threads=1 run
-----------
sysbench 1.0.17 (using system LuaJIT 2.0.4)

Running the test with following options:
Number of threads: 1
Initializing random number generator from current time


Prime numbers limit: 20000

Initializing worker threads...

Threads started!

CPU speed:
    events per second:   559.06

General statistics:
    total time:                          10.0012s
    total number of events:              5592

Latency (ms):
         min:                                    1.59
         avg:                                    1.79
         max:                                    5.26
         95th percentile:                        1.96
         sum:                                 9987.76

Threads fairness:
    events (avg/stddev):           5592.0000/0.00
    execution time (avg/stddev):   9.9878/0.00
А вот процессор в этом тесте показал результаты в 2 раза выше чем на тесте 2018 года с процессором Intel.
Sysbench CPU Mutex 64:
====================================================
sysbench mutex --threads=64 run
-----------
sysbench 1.0.17 (using system LuaJIT 2.0.4)

Running the test with following options:
Number of threads: 64
Initializing random number generator from current time


Initializing worker threads...

Threads started!


General statistics:
    total time:                          13.4024s
    total number of events:              64

Latency (ms):
         min:                                12141.20
         avg:                                12792.99
         max:                                13267.35
         95th percentile:                    13308.98
         sum:                               818751.44

Threads fairness:
    events (avg/stddev):           1.0000/0.00
    execution time (avg/stddev):   12.7930/0.28
7-zip benchmark
7-zip benchmark:
====================================================
7za b
-----------

7-Zip (a) [64] 16.02 : Copyright (c) 1999-2016 Igor Pavlov : 2016-05-21
p7zip Version 16.02 (locale=en_US.UTF-8,Utf16=on,HugeFiles=on,64 bits,1 CPU Common KVM processor (F61),ASM,AES-NI)

Common KVM processor (F61)
CPU Freq:  2756  2934  3006  3024  3019  2989  2881  2914  2999

RAM size:     990 MB,  # CPU hardware threads:   1
RAM usage:    435 MB,  # Benchmark threads:      1

                       Compressing  |                  Decompressing
Dict     Speed Usage    R/U Rating  |      Speed Usage    R/U Rating
         KiB/s     %   MIPS   MIPS  |      KiB/s     %   MIPS   MIPS

22:       1680    99   1645   1635  |      30598   100   2616   2613
23:       1636   100   1676   1668  |      30485   100   2641   2639
24:       1588   100   1710   1708  |      27996   100   2463   2458
25:       1393   100   1594   1591  |      29507   100   2627   2626
----------------------------------  | ------------------------------
Avr:             100   1656   1650  |              100   2587   2584
Tot:             100   2121   2117
На встроенном бенчмарке 7-zip интересные результаты. Скорость сжатия архива получилась ниже чем у процессора интел, а скорость разархивации выше.
ОЗУ
Memory size for Sysbench Memory test: 1G
Disk space for Sysbench Disk test: 2G
Sysbench Memory test:
====================================================
sysbench memory --num-threads=4 --memory-total-size=1G run
-----------
WARNING: --num-threads is deprecated, use --threads instead
sysbench 1.0.17 (using system LuaJIT 2.0.4)

Running the test with following options:
Number of threads: 4
Initializing random number generator from current time


Running memory speed test with the following options:
  block size: 1KiB
  total size: 1024MiB
  operation: write
  scope: global

Initializing worker threads...

Threads started!

Total operations: 1048576 (4099507.87 per second)

1024.00 MiB transferred (4003.43 MiB/sec)


General statistics:
    total time:                          0.2546s
    total number of events:              1048576

Latency (ms):
         min:                                    0.00
         avg:                                    0.00
         max:                                   44.23
         95th percentile:                        0.00
         sum:                                  365.20

Threads fairness:
    events (avg/stddev):           262144.0000/0.00
    execution time (avg/stddev):   0.0913/0.04
Сеть
Speedtest cli:
====================================================
speedtest-cli
-----------
Retrieving speedtest.net configuration...
Testing from Hosting technology LTD (195.2.74.246)...
Retrieving speedtest.net server list...
Selecting best server based on ping...
Hosted by Rostelecom (Moscow) [1.61 km]: 11.273 ms
Testing download speed................................................................................
Download: 451.12 Mbit/s
Testing upload speed....................................................................................................
Upload: 421.83 Mbit/s
Скорость сети получилась в 3 раза выше чем в тесте 2018 года.
Выводы
Тут честно даже и не знаю что сказать. На каких-то операциях процессор от AMD показал себя сильно производительнее процессора от Intel, а на каких-то показал результаты ниже.
В целом это достаточно производительная виртуалка за 300 рублей. Я считаю что можно смело брать.