![]()
Привет!
Я уже тестировал облако Hetzner когда оно только появилось в 2018 году, а сейчас решил сделать еще один тест.
В ноябре у данного хостинг-провайдера появилась новая локация в Ashburn, USA. Заодно я решил посмотреть стоит ли брать сервер в локации USA.
Панель управления
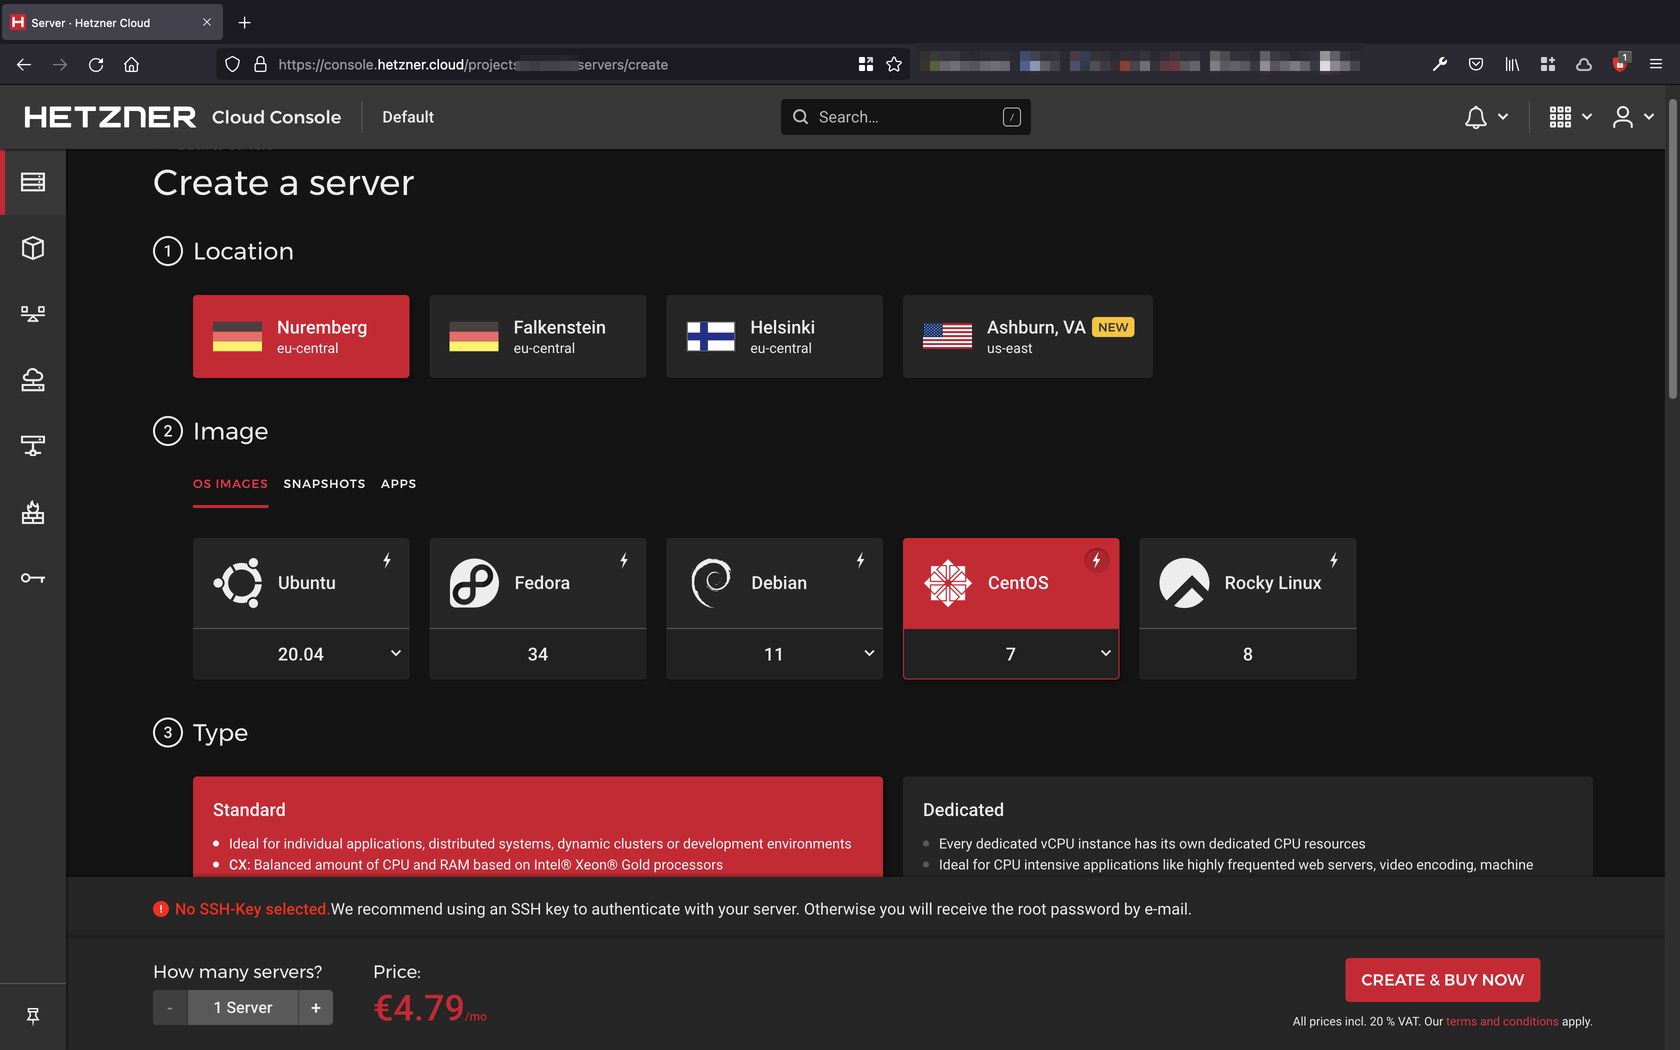
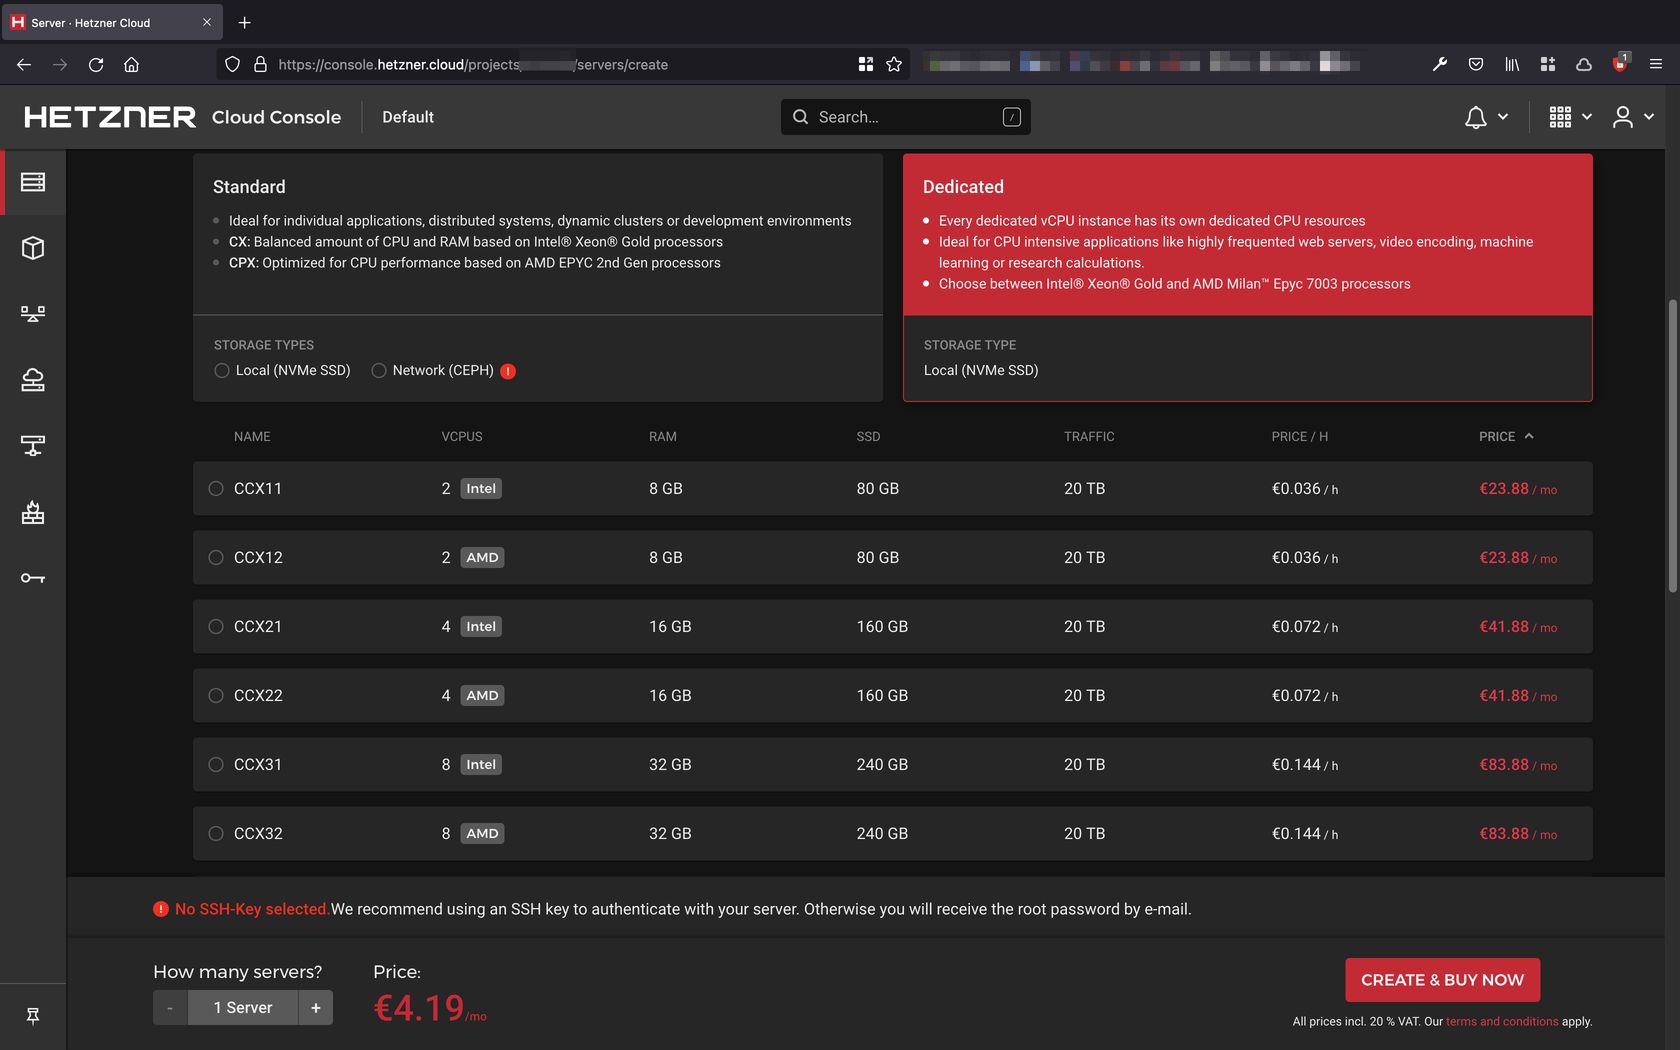
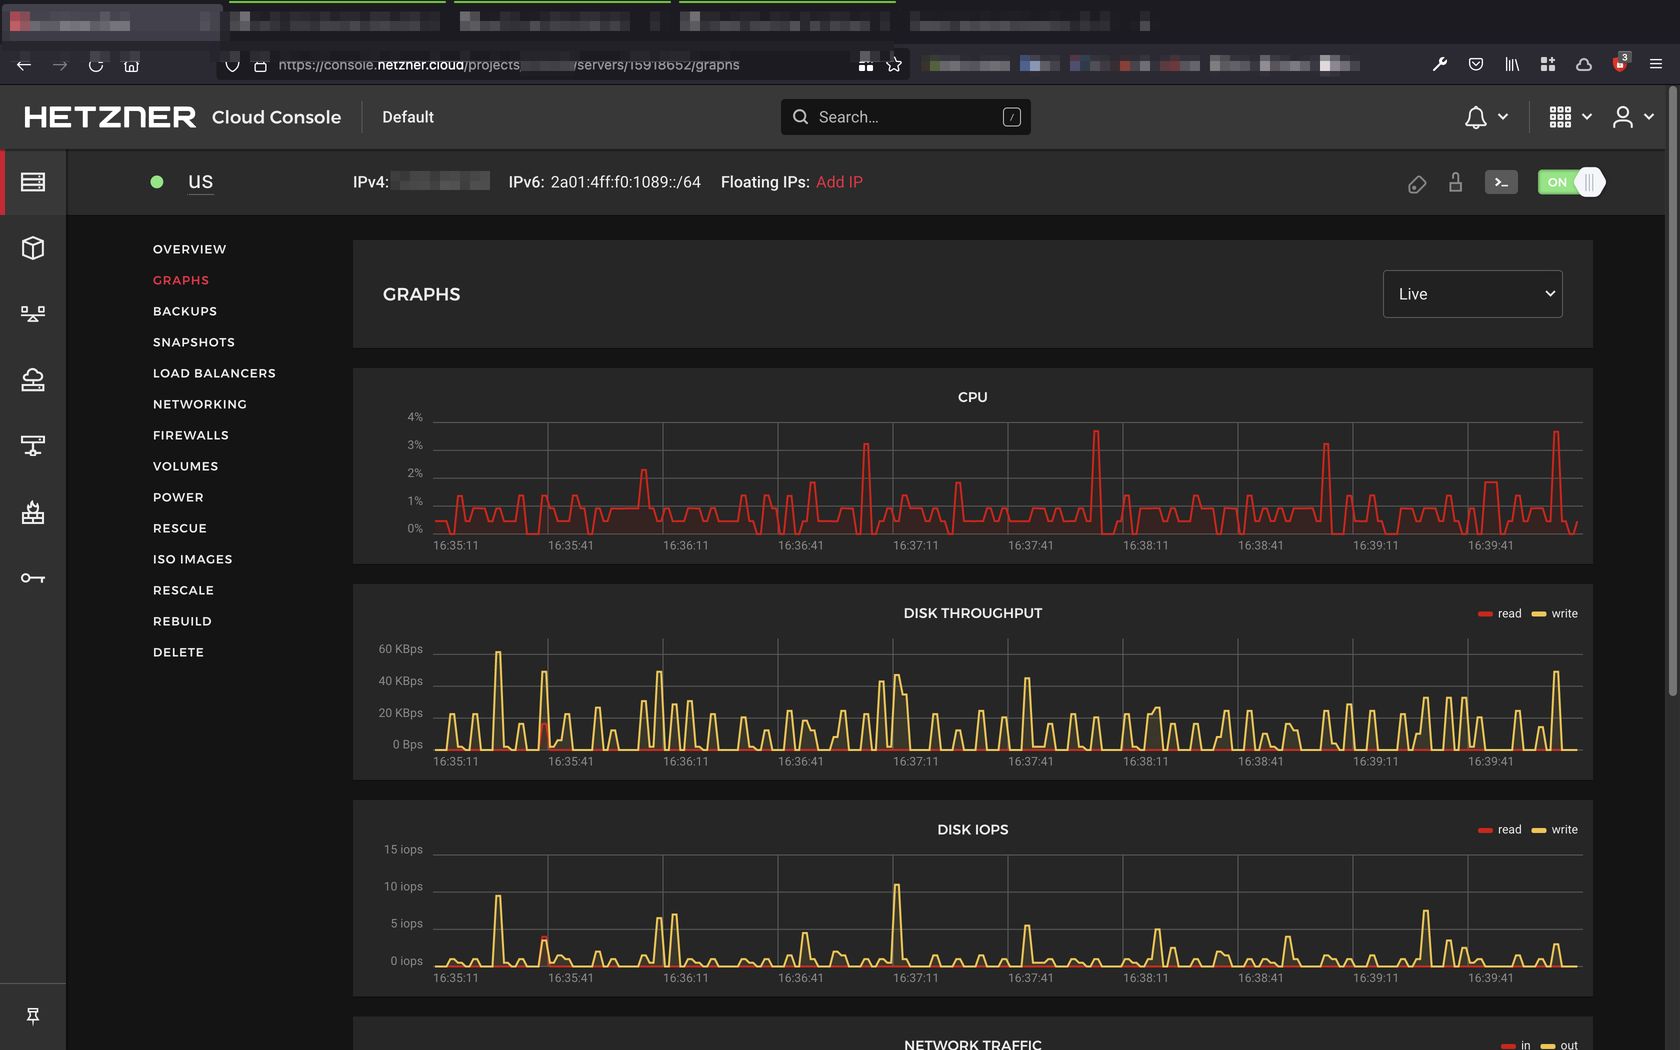
Давайте для начала посмотрим как изменилась панель управления. Главное изменение которое бросается в глаза это темная тема.
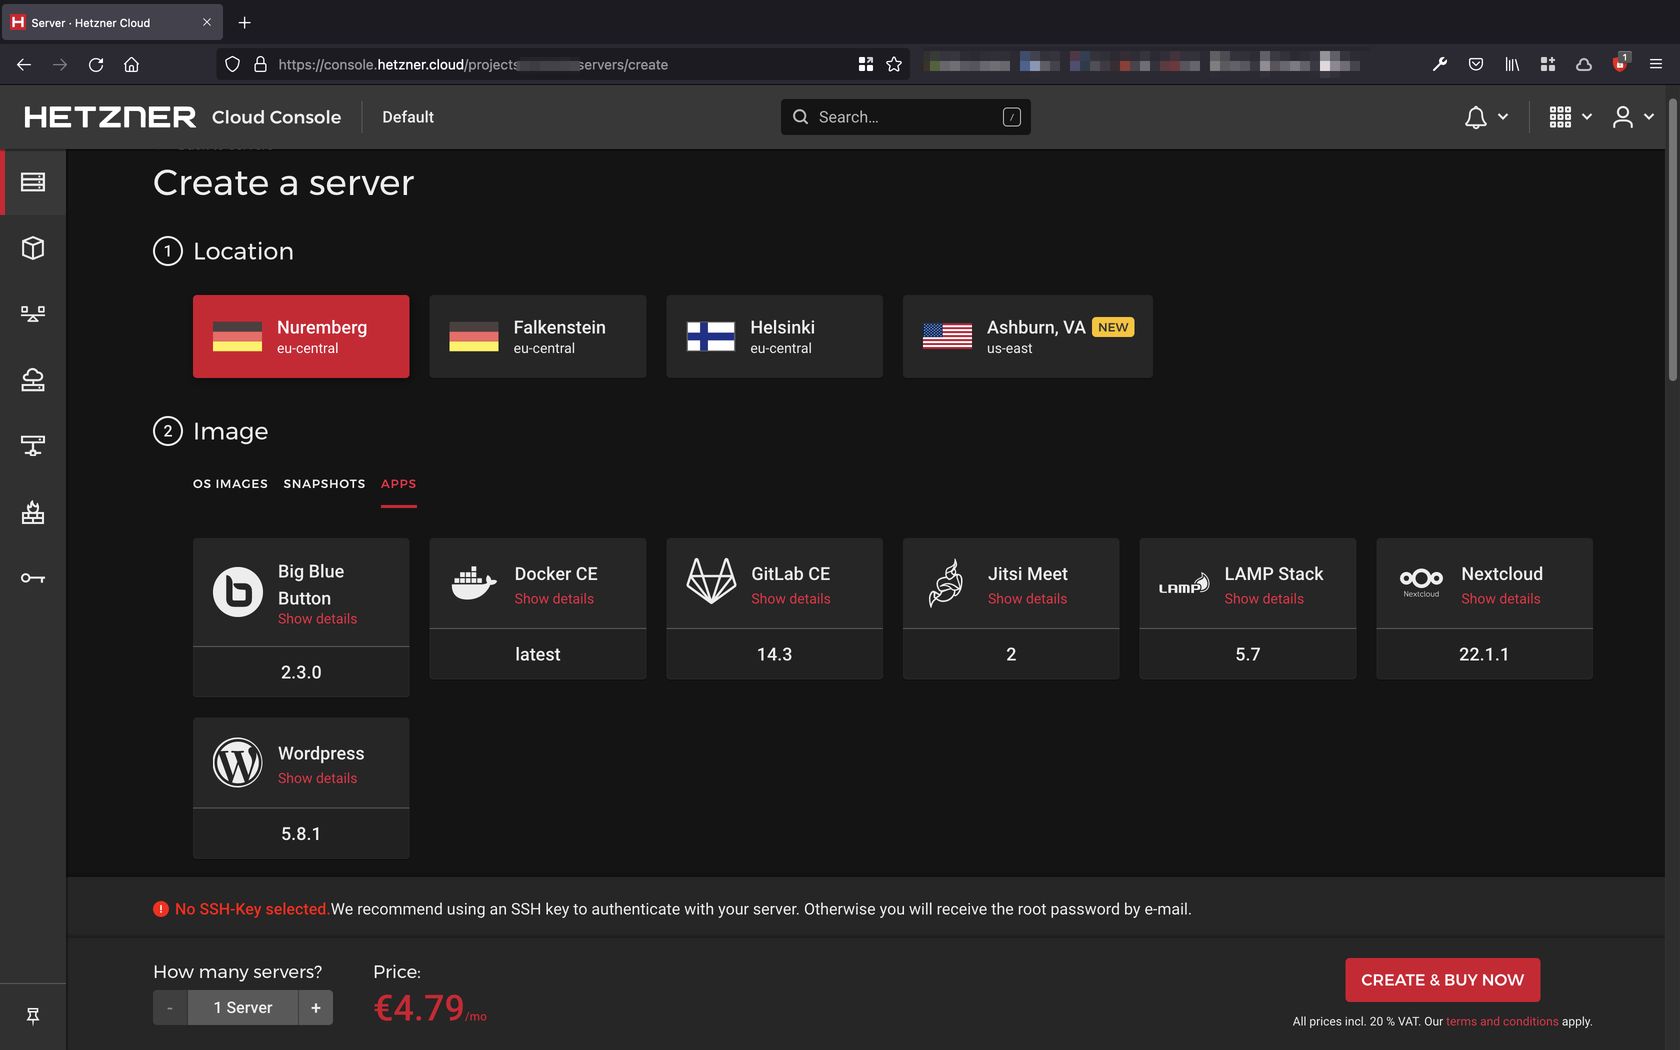
Также расширился список ОС доступных для установки на сервера и локаций теперь четыре вместо двух. Стоимость минимального тарифа теперь выше и самый дешевый сервер для пользователя из РФ обойдется в 4.19 евро.
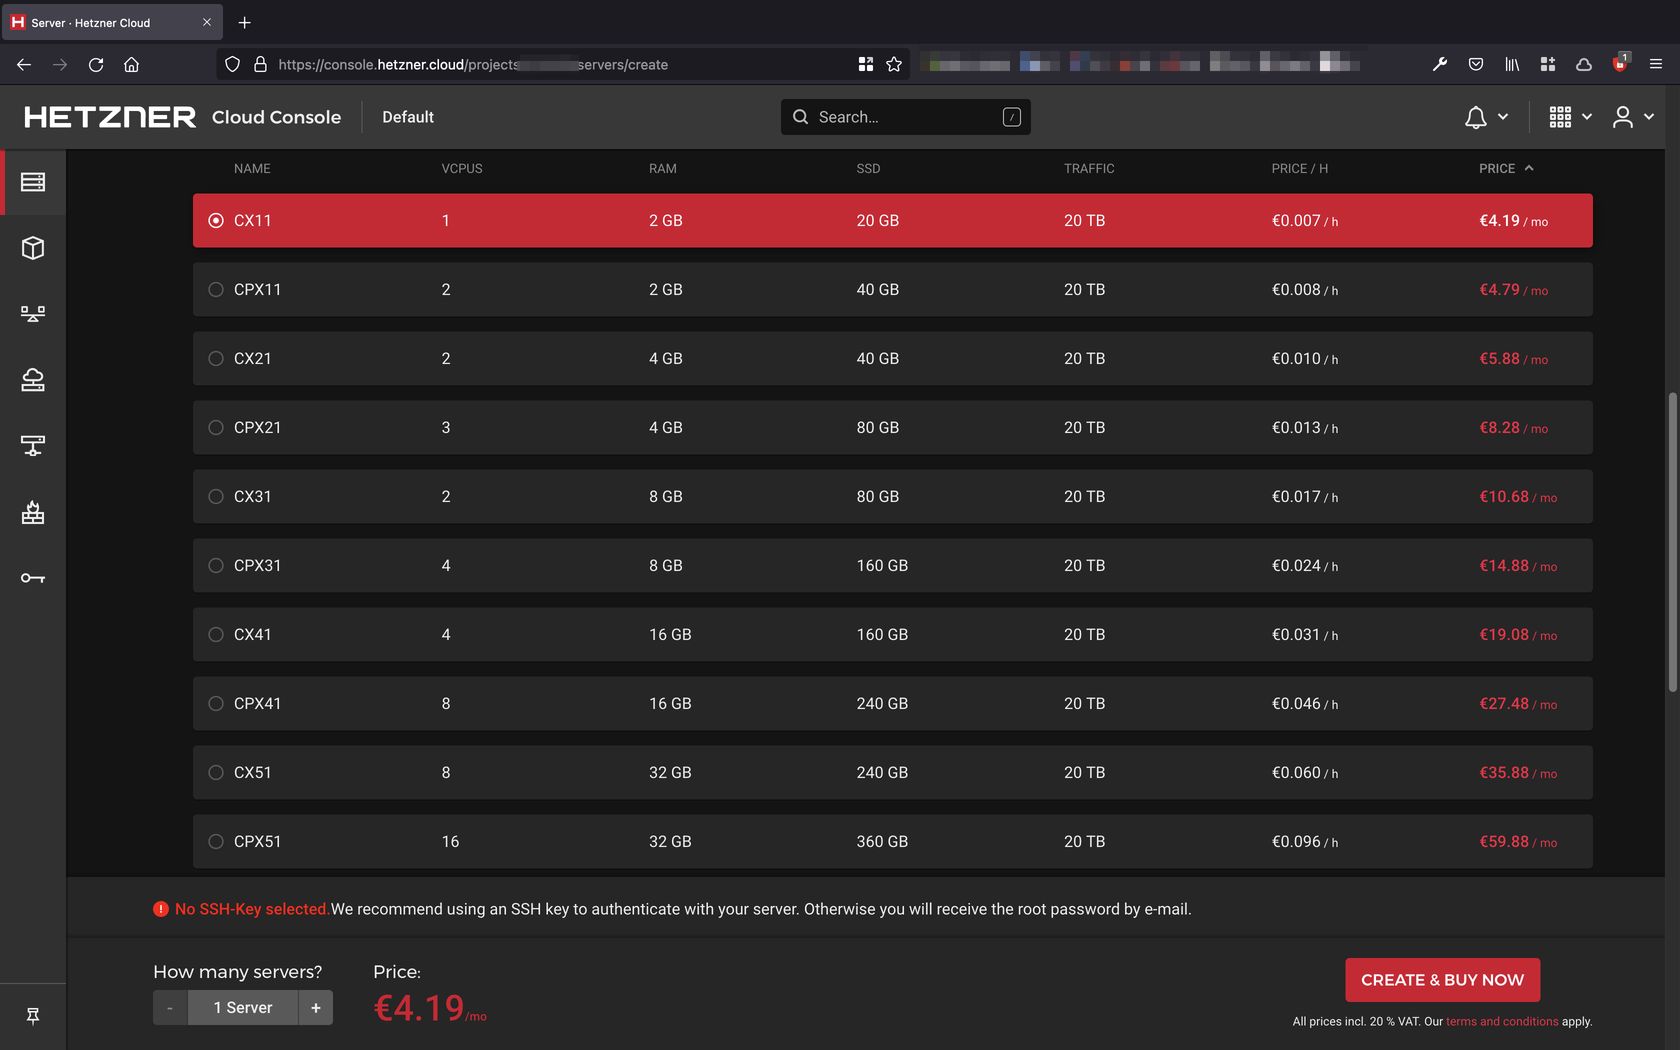
Набор доступных тарифов слегка отличатеся в разных локациях. К примеру в локации USA минимальный доступный тариф это CPX11 за 4.79 евро. Дело в том что по CPX-тарифам предоставляются сервера на процессорах AMD Epyc.
Видимо в новой локации нет серверов на Intel.
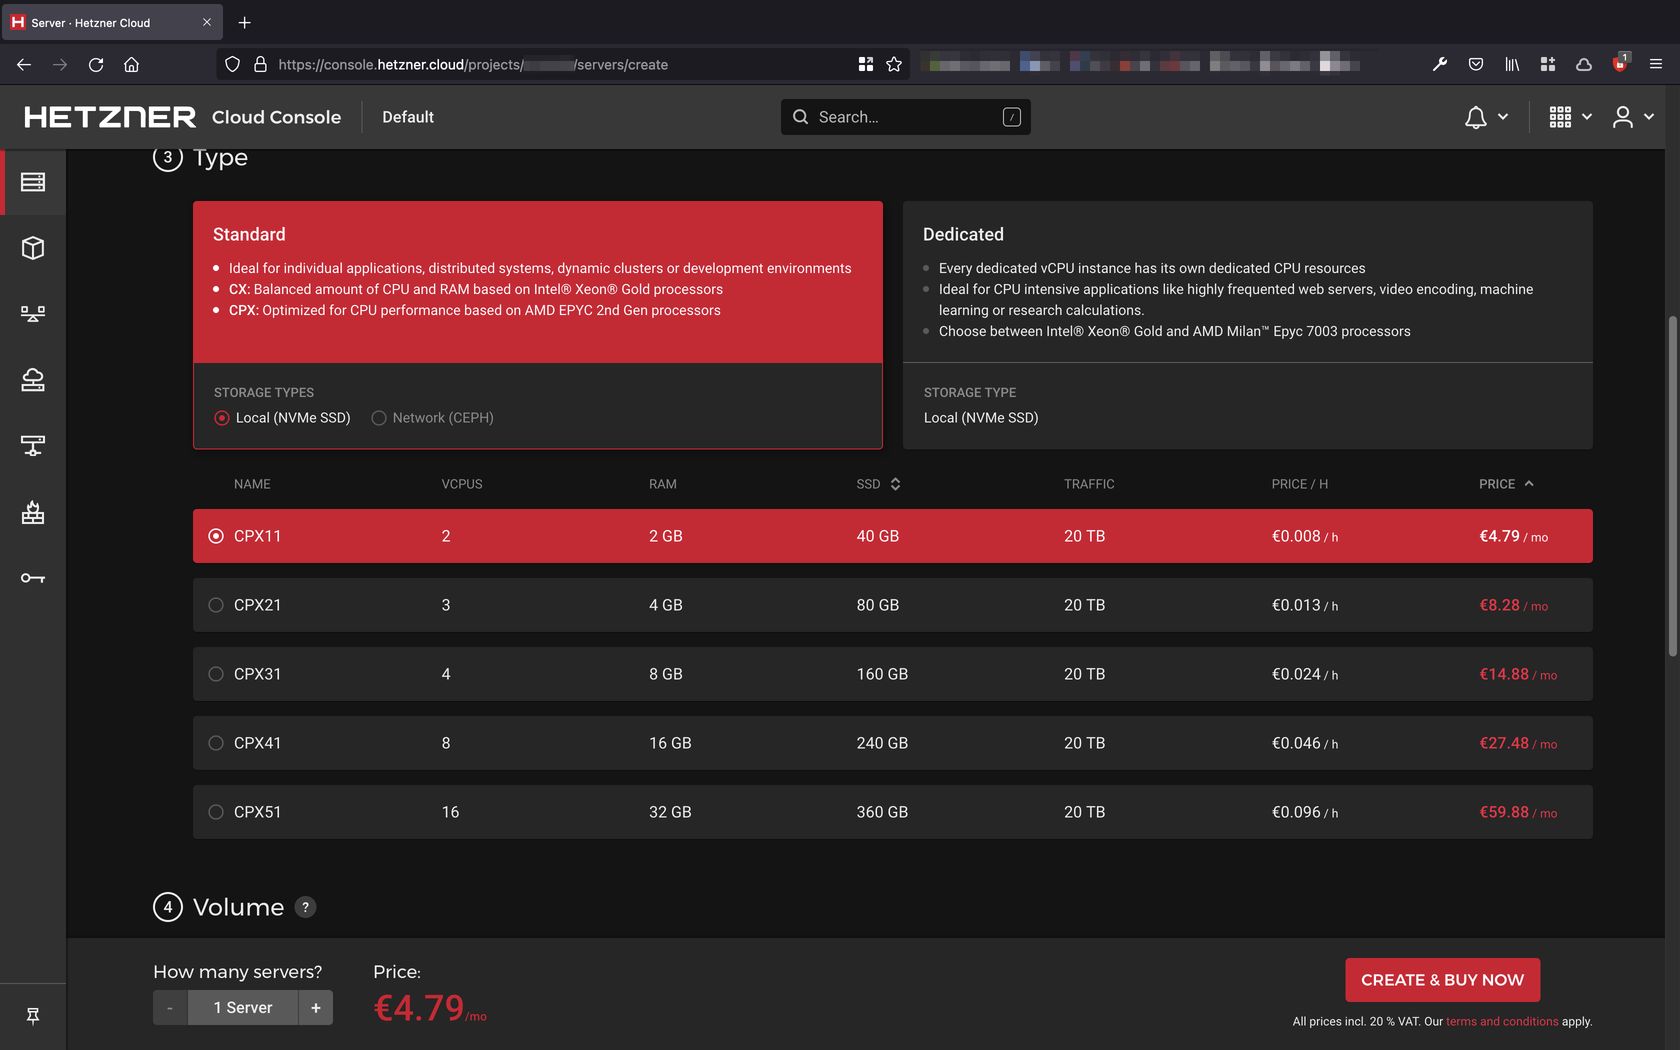
Есть возможность арендовать сервер с отдельным SSD (не пошаренным с другими пользователями).
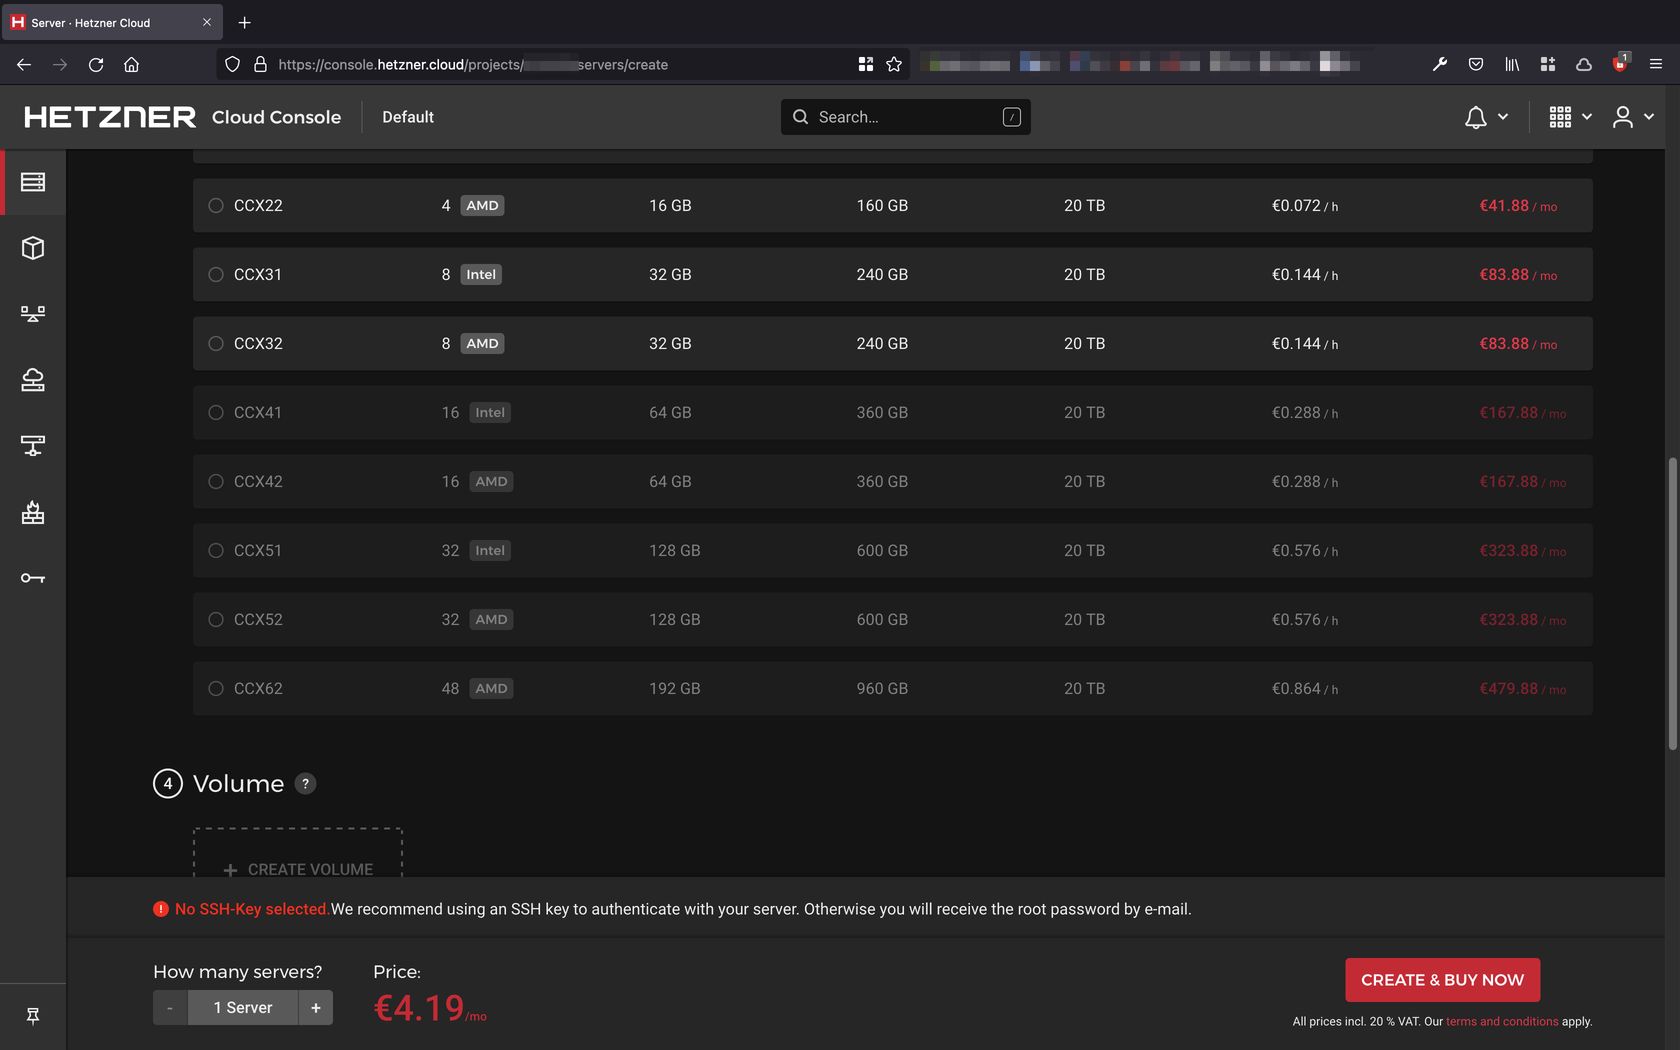
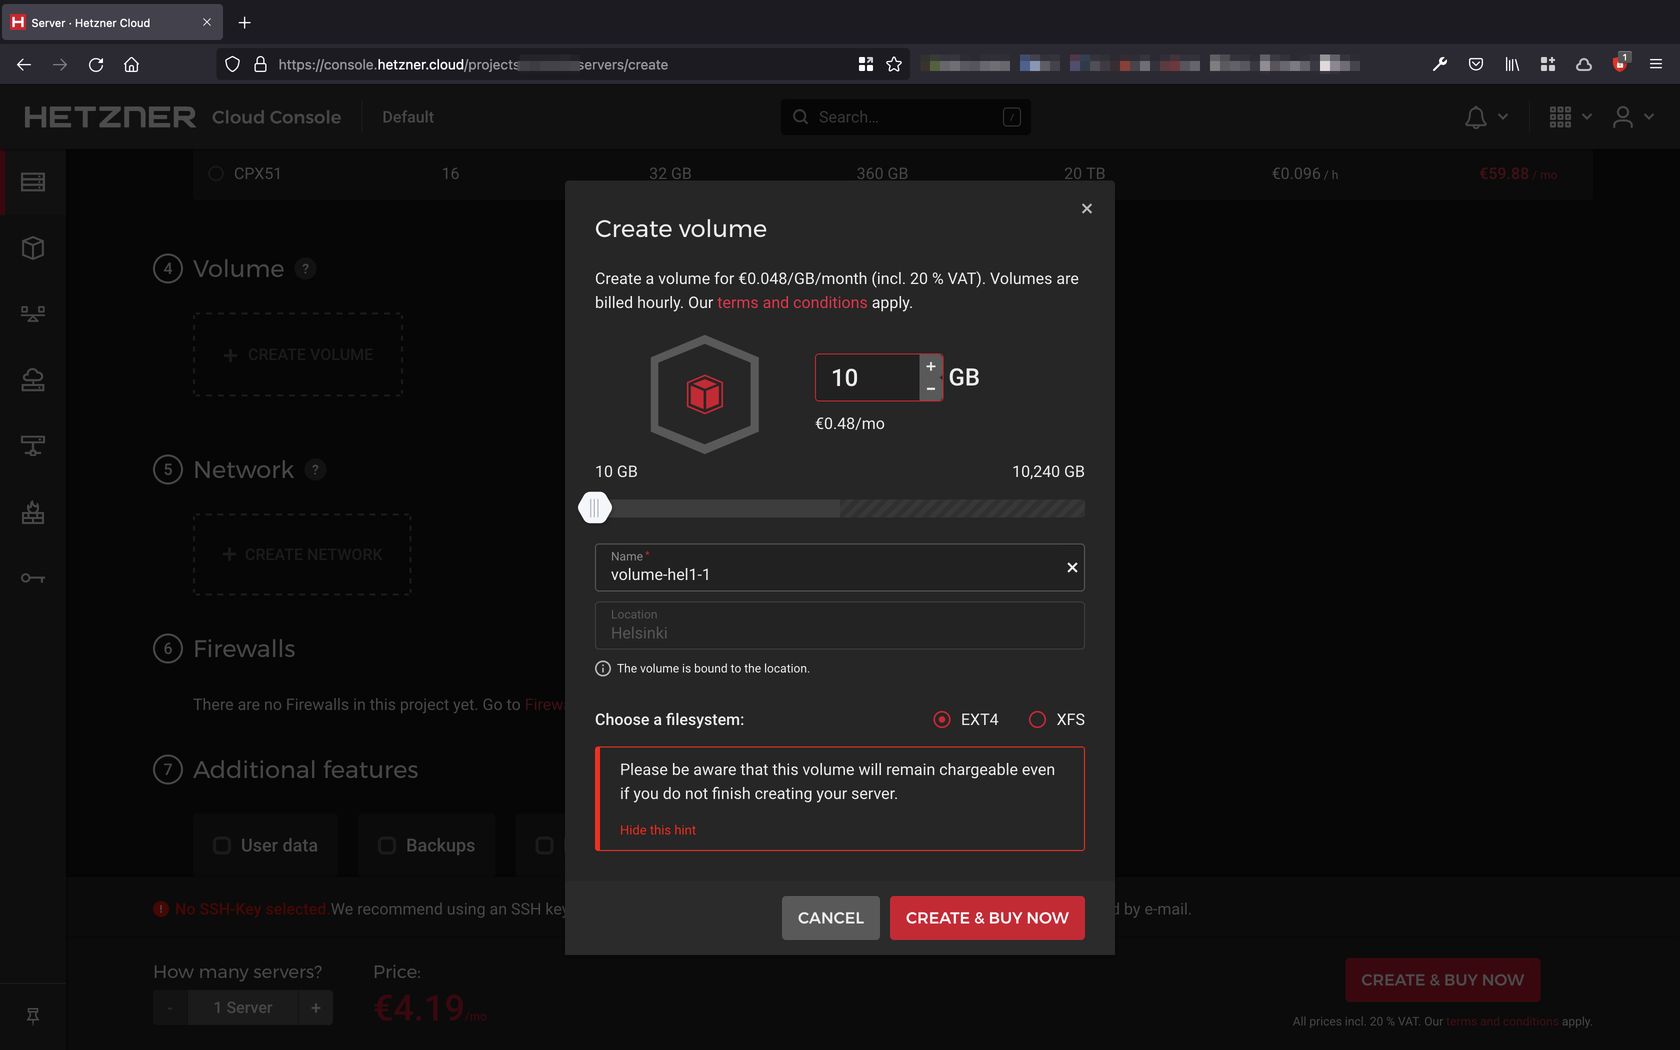
Также есть возможность приобрести отдельный Volume и монтировать его к серверам.
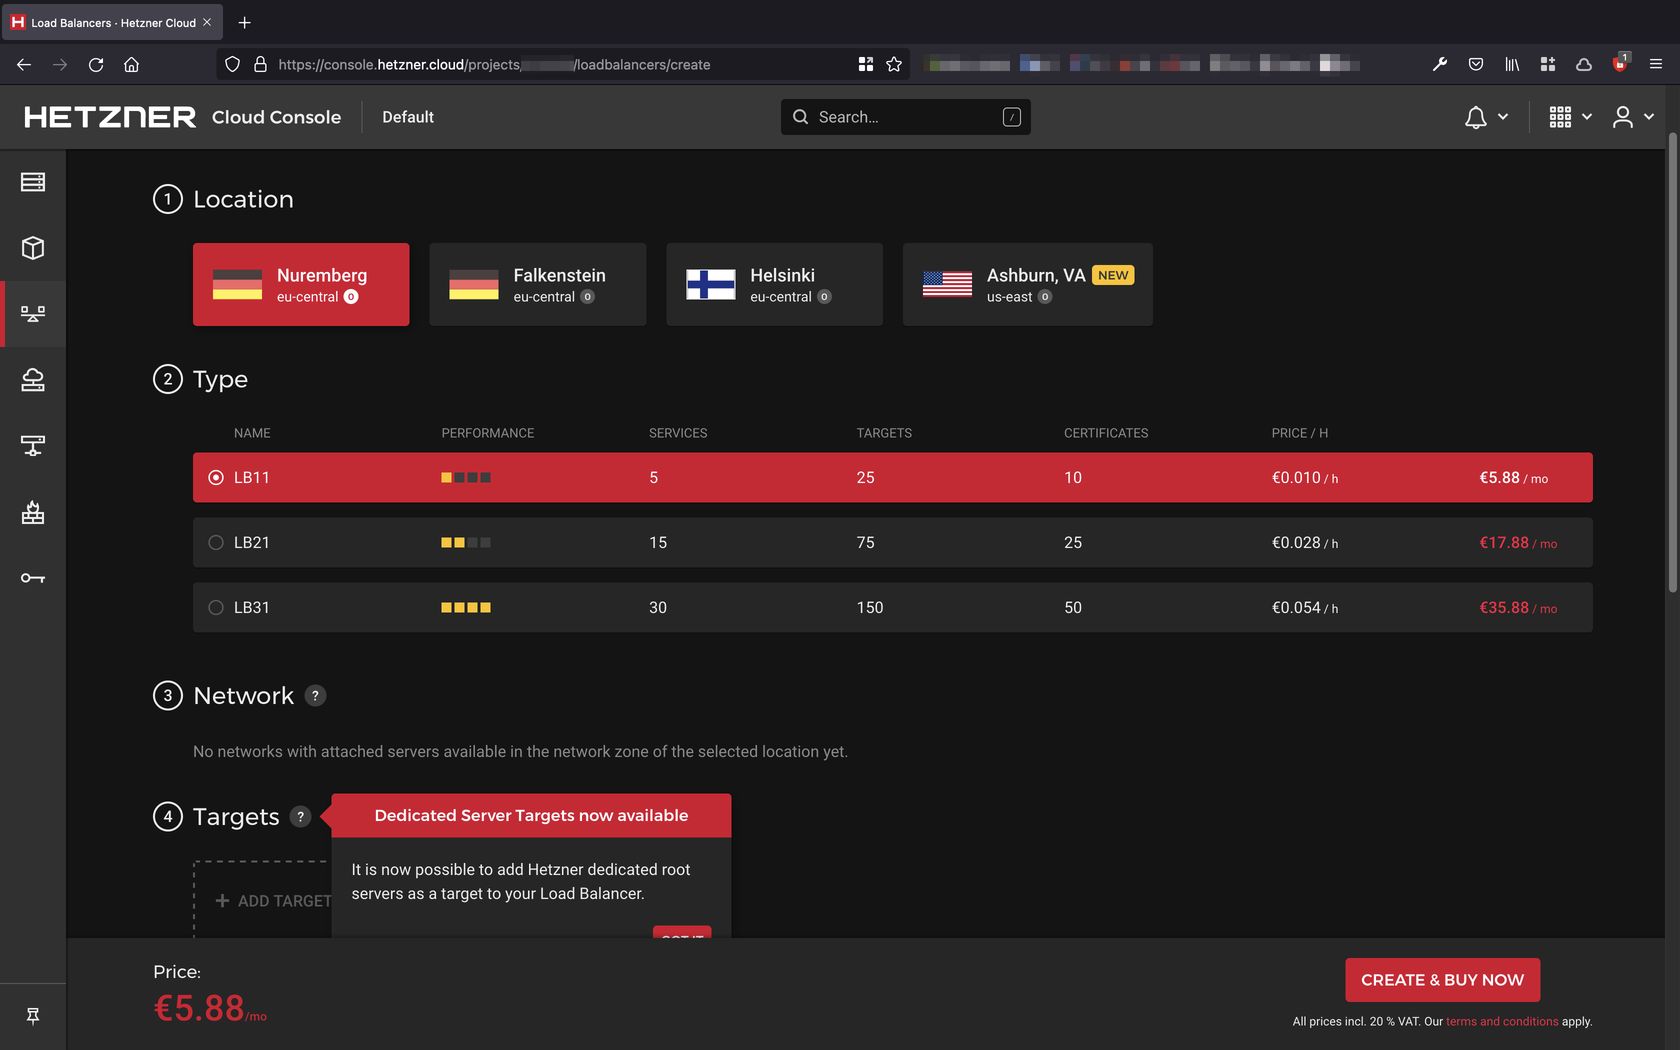
В этом разделе можно настроить Load Balancer.
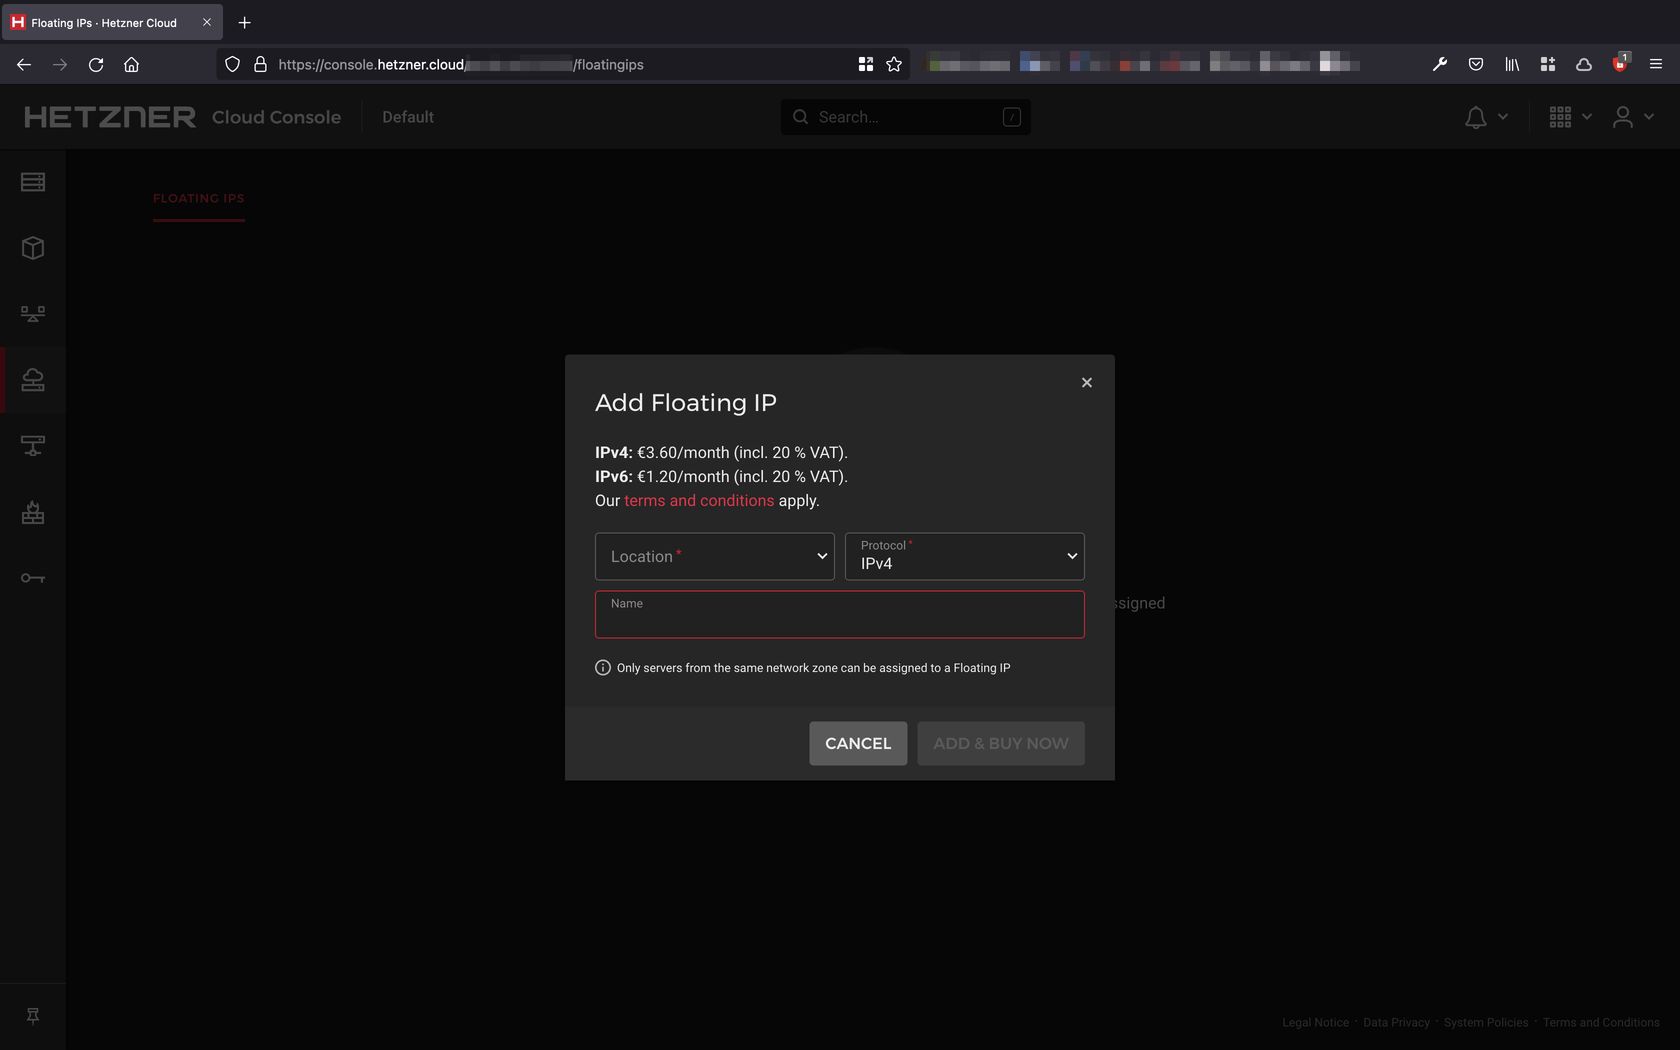
А в этом можно приобрести Floating IP и потом привязывать его к своим серверам при необходимости.
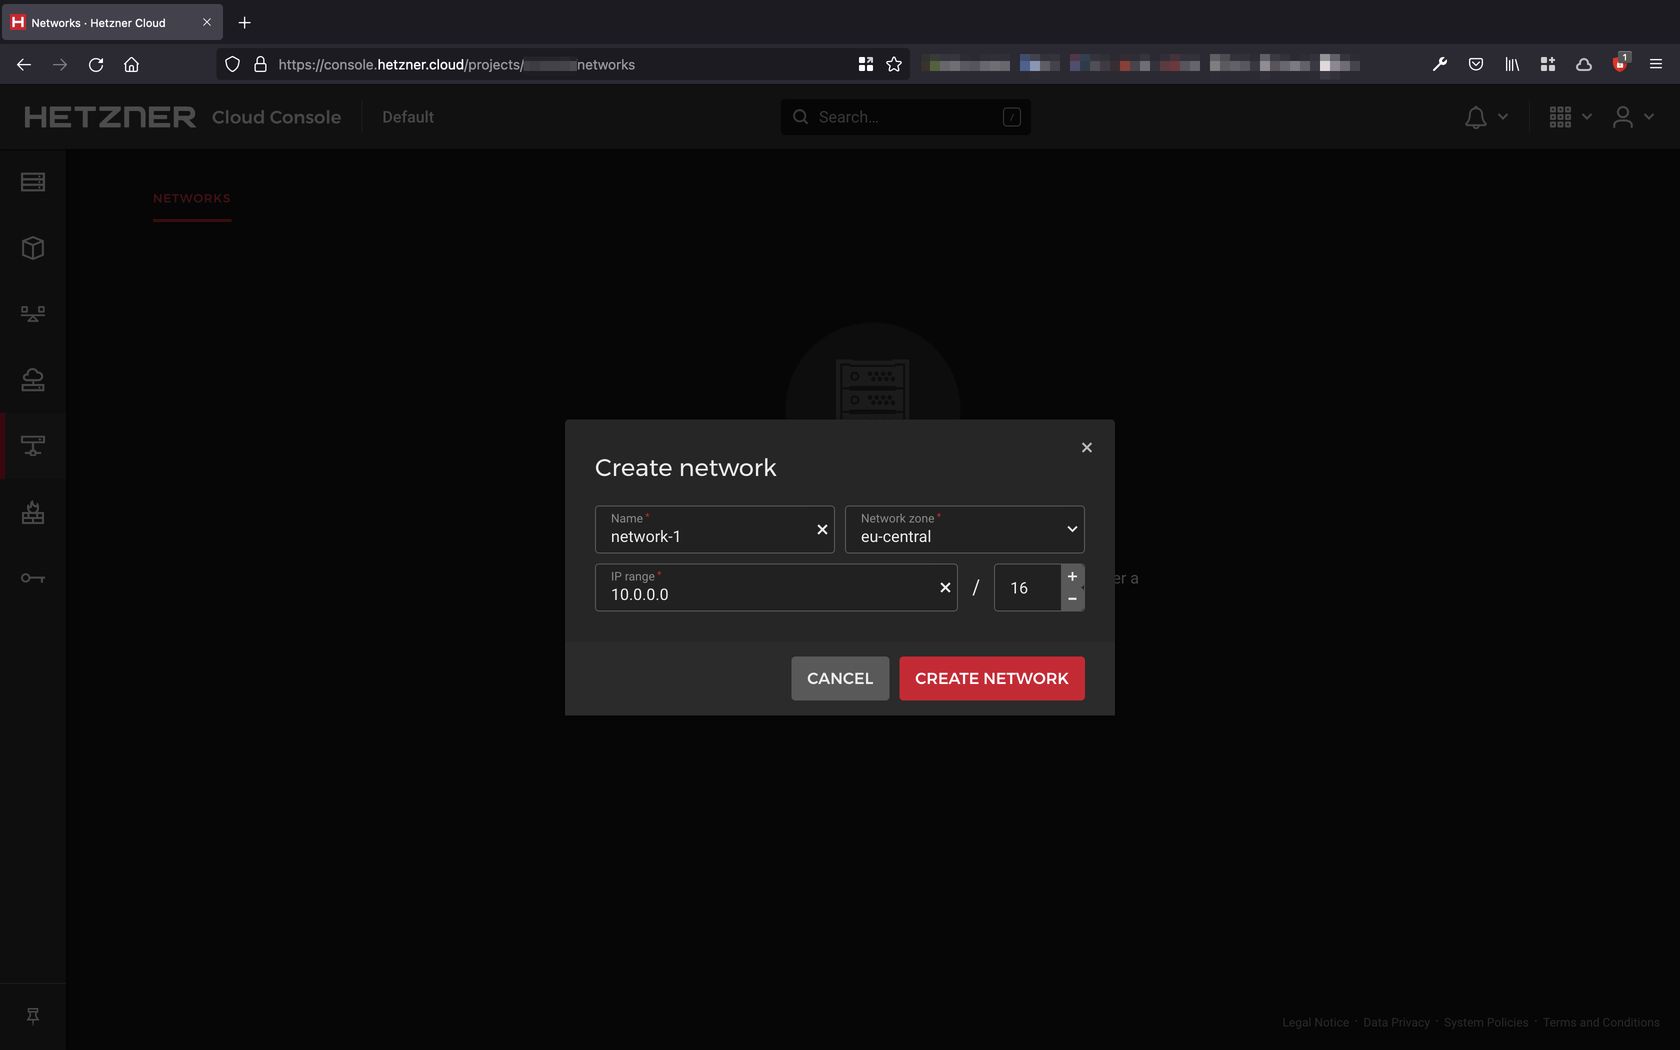
Также есть возможность создать внутреннюю сеть между своими серверами.
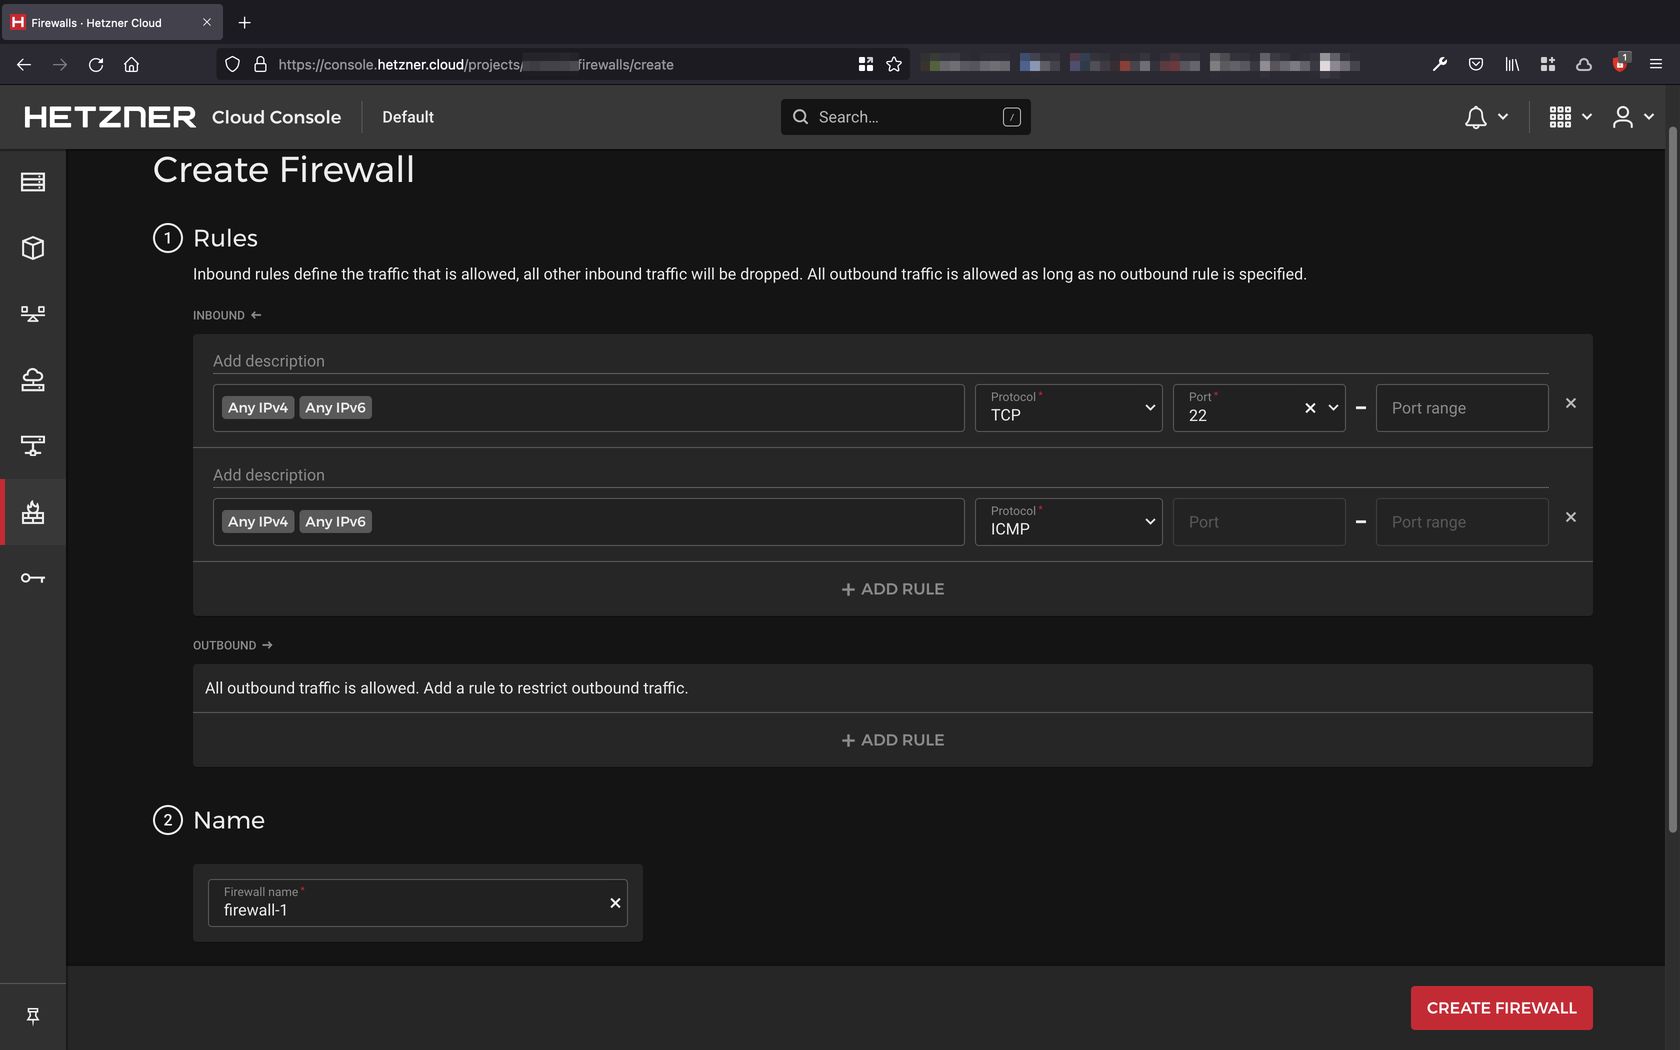
И настроить правила для Firewall.
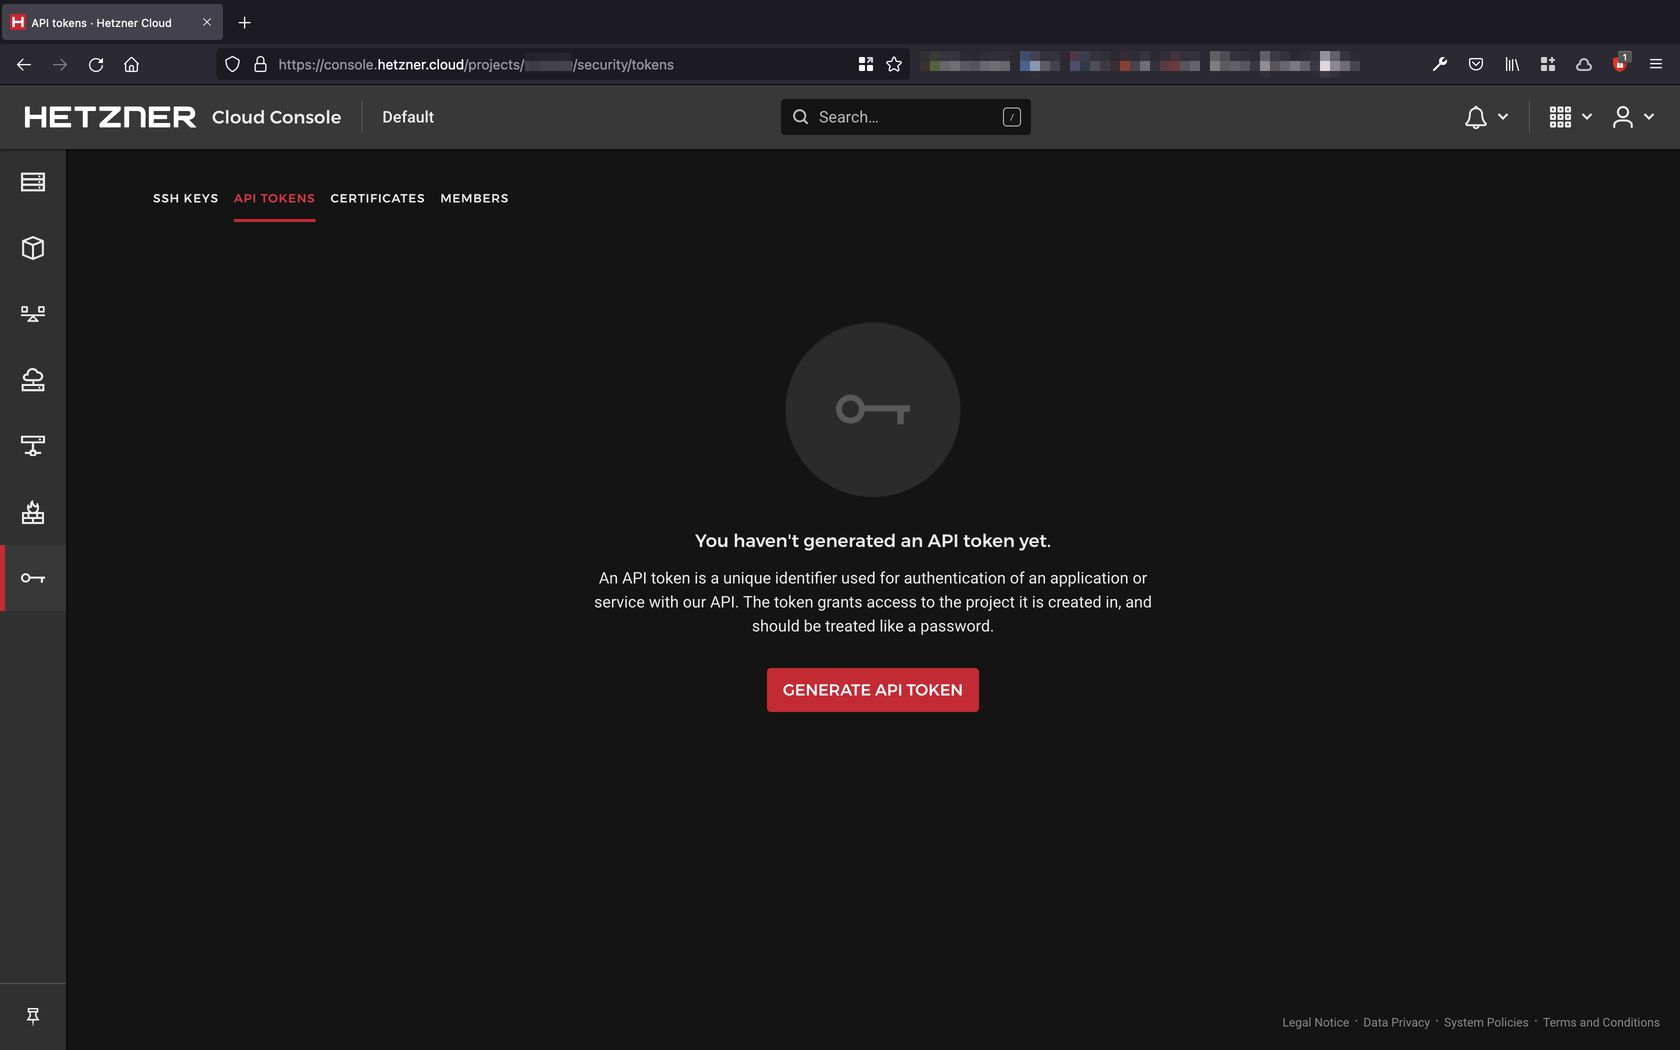
Вдобавок всем этим хозяйством можно управлять через API.
К примеру при помощи Terraform или Ansible.
У запущенных серверов доступны красивые графики отображающие нагрузку.
Итак, перейдем к тестам.
Локация DE
Сведения о VM
CX11 1 CPU 2Gb RAM 20Gb SSD
На сервере установлена CentOS 7.9
cat /etc/centos-release
-----------
CentOS Linux release 7.9.2009 (Core)

Kernel info:
====================================================
uname -a
-----------
Linux de 3.10.0-1160.45.1.el7.x86_64 #1 SMP Wed Oct 13 17:20:51 UTC 2021 x86_64 x86_64 x86_64 GNU/Linux
Inxi
inxi -b
-----------
System:    Host: de Kernel: 3.10.0-1160.45.1.el7.x86_64 x86_64 bits: 64 Console: tty pts/0
           Distro: CentOS Linux release 7.9.2009 (Core)
Machine:   Type: Kvm System: Hetzner product: vServer v: 20171111 serial: 15918685
           Mobo: N/A model: N/A serial: N/A BIOS: Hetzner v: 20171111 date: 11/11/2017
CPU:       Info: Single Core Intel Xeon (Skylake IBRS) [MCP] speed: 2100 MHz
Graphics:  Device-1: driver: bochs-drm v: N/A
           Display: server: No display server data found. Headless machine? tty: 160x48
           Message: Unable to show advanced data. Required tool glxinfo missing.
Network:   Device-1: Intel 82371AB/EB/MB PIIX4 ACPI type: network bridge driver: piix4_smbus
           Device-2: Red Hat Virtio network driver: virtio-pci
Drives:    Local Storage: total: 19.07 GiB used: 1.21 GiB (6.3%)
Info:      Processes: 76 Uptime: 4m Memory: 1.75 GiB used: 271.3 MiB (15.2%) Init: systemd runlevel: 3 Shell: Bash
           inxi: 3.3.06
Тут мы видим что нам доступно одно ядро процессора Intel Xeon частотой 2100 Mhz и доступно 1.75 гигабайт ОЗУ.
PT Summary
pt-summary
-----------
# Percona Toolkit System Summary Report ######################
        Date | 2021-11-11 12:08:40 UTC (local TZ: UTC +0000)
    Hostname | de
      Uptime | 4 min,  1 user,  load average: 0.40, 0.16, 0.07
      System | Hetzner; vServer; v20171111 (Other)
 Service Tag | 15918685
    Platform | Linux
     Release | CentOS Linux release 7.9.2009 (Core)
      Kernel | 3.10.0-1160.45.1.el7.x86_64
Architecture | CPU = 64-bit, OS = 64-bit
   Threading | NPTL 2.17
     SELinux | Permissive
 Virtualized | VMWare
# Processor ##################################################
  Processors | physical = 1, cores = 1, virtual = 1, hyperthreading = no
      Speeds | 1x2099.998
      Models | 1xIntel Xeon Processor (Skylake, IBRS)
      Caches | 1x16384 KB
# Memory #####################################################
       Total | 1.7G
        Free | 1.1G
        Used | physical = 97.6M, swap allocated = 0.0, swap used = 0.0, virtual = 97.6M
      Shared | 8.5M
     Buffers | 28.3M
      Caches | 563.5M
       Dirty | 69336 kB
     UsedRSS | 102.3M
  Swappiness | 30
 DirtyPolicy | 30, 10
 DirtyStatus | 0, 0
  Locator   Size     Speed             Form Factor   Type          Type Detail
  ========= ======== ================= ============= ============= ===========
  DIMM 0    2000 MB  Unknown           DIMM          RAM           Other
# Mounted Filesystems ########################################
  Filesystem  Size Used Type     Opts                                                      Mountpoint
  /dev/sda1    19G   7% ext4     rw,relatime,seclabel,data=ordered                         /
  devtmpfs    871M   0% devtmpfs rw,nosuid,seclabel,size=891788k,nr_inodes=222947,mode=755 /dev
  tmpfs       179M   0% tmpfs    rw,nosuid,nodev,seclabel                                  /run/user/0
  tmpfs       179M   0% tmpfs    rw,nosuid,nodev,seclabel,mode=755                         /run/user/0
  tmpfs       179M   0% tmpfs    rw,nosuid,nodev,relatime,seclabel,size=183284k,mode=700   /run/user/0
  tmpfs       179M   0% tmpfs    ro,nosuid,nodev,noexec,seclabel,mode=755                  /run/user/0
  tmpfs       895M   0% tmpfs    rw,nosuid,nodev,seclabel                                  /dev/shm
  tmpfs       895M   0% tmpfs    rw,nosuid,nodev,seclabel,mode=755                         /dev/shm
  tmpfs       895M   0% tmpfs    rw,nosuid,nodev,relatime,seclabel,size=183284k,mode=700   /dev/shm
  tmpfs       895M   0% tmpfs    ro,nosuid,nodev,noexec,seclabel,mode=755                  /dev/shm
  tmpfs       895M   0% tmpfs    rw,nosuid,nodev,seclabel                                  /sys/fs/cgroup
  tmpfs       895M   0% tmpfs    rw,nosuid,nodev,seclabel,mode=755                         /sys/fs/cgroup
  tmpfs       895M   0% tmpfs    rw,nosuid,nodev,relatime,seclabel,size=183284k,mode=700   /sys/fs/cgroup
  tmpfs       895M   0% tmpfs    ro,nosuid,nodev,noexec,seclabel,mode=755                  /sys/fs/cgroup
  tmpfs       895M   1% tmpfs    rw,nosuid,nodev,seclabel                                  /run
  tmpfs       895M   1% tmpfs    rw,nosuid,nodev,seclabel,mode=755                         /run
  tmpfs       895M   1% tmpfs    rw,nosuid,nodev,relatime,seclabel,size=183284k,mode=700   /run
  tmpfs       895M   1% tmpfs    ro,nosuid,nodev,noexec,seclabel,mode=755                  /run
# Disk Schedulers And Queue Size #############################
         sda | [deadline] 128
         sr0 | [deadline] 128
# Disk Partioning ############################################
Device       Type      Start        End               Size
============ ==== ========== ========== ==================
/dev/sda     Disk                              20480786432
/dev/sda1    Part       2048   40001502        20479720448
# Kernel Inode State #########################################
dentry-state | 35350	23715	45	0	10356	0
     file-nr | 832	0	174941
    inode-nr | 24137	369
# LVM Volumes ################################################
Unable to collect information
# LVM Volume Groups ##########################################
Unable to collect information
# RAID Controller ############################################
  Controller | No RAID controller detected
# Network Config #############################################
  Controller | Red Hat, Inc. Virtio network device
 FIN Timeout | 60
  Port Range | 60999
# Interface Statistics #######################################
  interface  rx_bytes rx_packets  rx_errors   tx_bytes tx_packets  tx_errors
  ========= ========= ========== ========== ========== ========== ==========
  lo             2500         30          0       2500         30          0
  eth0       80000000      15000          0    1250000       9000          0
# Network Devices ############################################
  Device    Speed     Duplex
  ========= ========= =========
  eth0
# Network Connections ########################################
  Connections from remote IP addresses
    2a00                4
    217.72.xxx.xxx      2
    2001                1
  Connections to local IP addresses
    2a01               15
  Connections to top 10 local ports
    44732               2
    57948               1
    58026               1
    58070               1
    58200               1
    59512               1
    60292               1
    60302               1
    60526               1
    60872               1
  States of connections
    ESTABLISHED         1
    LISTEN              2
    TIME_WAIT         100
# Top Processes ##############################################
  PID USER      PR  NI    VIRT    RES    SHR S %CPU %MEM     TIME+ COMMAND
    1 root      20   0  128128   6804   4220 S  0.0  0.4   0:02.19 systemd
    2 root      20   0       0      0      0 S  0.0  0.0   0:00.00 kthreadd
    3 root      20   0       0      0      0 S  0.0  0.0   0:00.00 kworker/0:0
    4 root       0 -20       0      0      0 S  0.0  0.0   0:00.00 kworker/0:0H
    5 root      20   0       0      0      0 S  0.0  0.0   0:00.00 kworker/u2:0
    6 root      20   0       0      0      0 S  0.0  0.0   0:00.05 ksoftirqd/0
    7 root      rt   0       0      0      0 S  0.0  0.0   0:00.00 migration/0
    8 root      20   0       0      0      0 S  0.0  0.0   0:00.00 rcu_bh
    9 root      20   0       0      0      0 R  0.0  0.0   0:00.32 rcu_sched
# Notable Processes ##########################################
  PID    OOM    COMMAND
 1199    -17    sshd
# Simplified and fuzzy rounded vmstat (wait please) ##########
  procs  ---swap-- -----io---- ---system---- --------cpu--------
   r  b    si   so    bi    bo     ir     cs  us  sy  il  wa  st
   2  0     0    0   900  1500    300    350  11   5  83   1   0
   0  0     0    0   100     0    250    700  10  15  75   0   0
   0  0     0    0     0     0     20     35   0   0 100   0   0
   0  0     0    0     0     0     25     35   0   0 100   0   0
   0  0     0    0     0 70000    600     45   0   4  95   1   0
# Memory mamagement ##########################################
Transparent huge pages are enabled.
# The End ####################################################
Тесты
Диск
Скорость диска буду сравнивать с сервером от VDSina так как это один из самых свежих тестов (прошлогодний, ага xD) и с CPX11 US.
DD
dd if=/dev/zero of=test bs=64k count=16k conv=fdatasync 2>&1
rm -f test
-----------
16384+0 records in
16384+0 records out
1073741824 bytes (1.1 GB) copied, 1.19197 s, 901 MB/s
16384+0 records in
16384+0 records out
1073741824 bytes (1.1 GB) copied, 1.04408 s, 1.0 GB/s
16384+0 records in
16384+0 records out
1073741824 bytes (1.1 GB) copied, 1.04537 s, 1.0 GB/s
Скорость линейной записи тут отличная, почти 1 гигабайт в секунду. Это на 25-30% выше чем в вдсине, но CPX11 US здесь круче в полтора раза!
Sysbench тест диска
Подготавливаем тестовые файлы.
sysbench fileio --file-total-size=2G prepare
-----------
sysbench 1.0.17 (using system LuaJIT 2.0.4)

128 files, 16384Kb each, 2048Mb total
Creating files for the test...
Extra file open flags: (none)
Creating file test_file.0
...
Creating file test_file.127
2147483648 bytes written in 4.27 seconds (479.93 MiB/sec).
sysbench fileio --file-total-size=2G --file-test-mode=rndrw --time=300 --max-requests=0 run
Кстати, в предыдущем тесте сервера из Oracle Free Tier эти файлы готовились около 40 секунд, а тут в 10 раз быстрее.
Запускаем тест
sysbench fileio --file-total-size=2G --file-test-mode=rndrw --time=300 --max-requests=0 run
-----------
sysbench 1.0.17 (using system LuaJIT 2.0.4)

Running the test with following options:
Number of threads: 1
Initializing random number generator from current time


Extra file open flags: (none)
128 files, 16MiB each
2GiB total file size
Block size 16KiB
Number of IO requests: 0
Read/Write ratio for combined random IO test: 1.50
Periodic FSYNC enabled, calling fsync() each 100 requests.
Calling fsync() at the end of test, Enabled.
Using synchronous I/O mode
Doing random r/w test
Initializing worker threads...

Threads started!


File operations:
    reads/s:                      2151.65
    writes/s:                     1434.44
    fsyncs/s:                     4590.60

Throughput:
    read, MiB/s:                  33.62
    written, MiB/s:               22.41

General statistics:
    total time:                          300.0099s
    total number of events:              2453045

Latency (ms):
         min:                                    0.00
         avg:                                    0.12
         max:                                  113.76
         95th percentile:                        0.42
         sum:                               298083.34

Threads fairness:
    events (avg/stddev):           2453045.0000/0.00
    execution time (avg/stddev):   298.0833/0.00
Тут все на высоте. Уделываем вдсину, но немного сливаем CPX11 US.
Процессор
Sysbench CPU:
====================================================
sysbench cpu --cpu-max-prime=20000 --num-threads=1 run
-----------
sysbench 1.0.17 (using system LuaJIT 2.0.4)

Running the test with following options:
Number of threads: 1
Initializing random number generator from current time


Prime numbers limit: 20000

Initializing worker threads...

Threads started!

CPU speed:
    events per second:   355.17

General statistics:
    total time:                          10.0012s
    total number of events:              3553

Latency (ms):
         min:                                    2.69
         avg:                                    2.81
         max:                                   10.29
         95th percentile:                        3.19
         sum:                                 9996.02

Threads fairness:
    events (avg/stddev):           3553.0000/0.00
    execution time (avg/stddev):   9.9960/0.00
А вот тут мы в полтора раза сливаем вдсине и почти в 4 раза сливаем CPX11 US.
Sysbench CPU Mutex 64:
====================================================
sysbench mutex --threads=64 run
-----------
sysbench 1.0.17 (using system LuaJIT 2.0.4)

Running the test with following options:
Number of threads: 64
Initializing random number generator from current time


Initializing worker threads...

Threads started!


General statistics:
    total time:                          12.6395s
    total number of events:              64

Latency (ms):
         min:                                11406.46
         avg:                                12070.10
         max:                                12458.88
         95th percentile:                    12384.09
         sum:                               772486.14

Threads fairness:
    events (avg/stddev):           1.0000/0.00
    execution time (avg/stddev):   12.0701/0.24
Здесь результаты примерно такие же как у сервера VDSina на процессоре AMD Epyc, но в 2 раза хуже чем у CPX11.
7-zip benchmark
7-zip benchmark:
====================================================
7za b
-----------

7-Zip (a) [64] 16.02 : Copyright (c) 1999-2016 Igor Pavlov : 2016-05-21
p7zip Version 16.02 (locale=en_US.UTF-8,Utf16=on,HugeFiles=on,64 bits,1 CPU Intel Xeon Processor (Skylake, IBRS) (50654),ASM,AES-NI)

Intel Xeon Processor (Skylake, IBRS) (50654)
CPU Freq:  2685  2742  2751  2769  2749  2715  2755  2766  2764

RAM size:    1789 MB,  # CPU hardware threads:   1
RAM usage:    435 MB,  # Benchmark threads:      1

                       Compressing  |                  Decompressing
Dict     Speed Usage    R/U Rating  |      Speed Usage    R/U Rating
         KiB/s     %   MIPS   MIPS  |      KiB/s     %   MIPS   MIPS

22:       2813   100   2744   2737  |      30841   100   2640   2633
23:       2749   100   2804   2802  |      30454   100   2647   2636
24:       2609   100   2807   2806  |      30292   100   2660   2659
25:       2439   100   2789   2785  |      29080    99   2601   2588
----------------------------------  | ------------------------------
Avr:             100   2786   2783  |              100   2637   2629
Tot:             100   2712   2706
Тут результаты чуть лучше чем у вдсины, но вдвое хуже чем у CPX11.
ОЗУ
Memory size for Sysbench Memory test: 1G
Disk space for Sysbench Disk test: 2G
Sysbench Memory test:
====================================================
sysbench memory --num-threads=4 --memory-total-size=1G run
-----------
WARNING: --num-threads is deprecated, use --threads instead
sysbench 1.0.17 (using system LuaJIT 2.0.4)

Running the test with following options:
Number of threads: 4
Initializing random number generator from current time


Running memory speed test with the following options:
  block size: 1KiB
  total size: 1024MiB
  operation: write
  scope: global

Initializing worker threads...

Threads started!

Total operations: 1048576 (3698506.86 per second)

1024.00 MiB transferred (3611.82 MiB/sec)


General statistics:
    total time:                          0.2816s
    total number of events:              1048576

Latency (ms):
         min:                                    0.00
         avg:                                    0.00
         max:                                   44.01
         95th percentile:                        0.00
         sum:                                  386.98

Threads fairness:
    events (avg/stddev):           262144.0000/0.00
    execution time (avg/stddev):   0.0967/0.02
Тут скорость работы ОЗУ чуть хуже чем у вдсины, но почти вдвое лучше чем у CPX11.
Пинг из Ульяновска
➜ ping 49.12.230.74
PING 49.12.230.74 (49.12.230.74): 56 data bytes
64 bytes from 49.12.230.74: icmp_seq=0 ttl=51 time=85.213 ms
64 bytes from 49.12.230.74: icmp_seq=1 ttl=51 time=63.763 ms
64 bytes from 49.12.230.74: icmp_seq=2 ttl=51 time=55.620 ms
64 bytes from 49.12.230.74: icmp_seq=3 ttl=51 time=66.029 ms
64 bytes from 49.12.230.74: icmp_seq=4 ttl=51 time=55.676 ms
64 bytes from 49.12.230.74: icmp_seq=5 ttl=51 time=78.150 ms
64 bytes from 49.12.230.74: icmp_seq=6 ttl=51 time=60.293 ms
64 bytes from 49.12.230.74: icmp_seq=7 ttl=51 time=61.169 ms
64 bytes from 49.12.230.74: icmp_seq=8 ttl=51 time=68.982 ms
64 bytes from 49.12.230.74: icmp_seq=9 ttl=51 time=61.103 ms
^C
--- 49.12.230.74 ping statistics ---
10 packets transmitted, 10 packets received, 0.0% packet loss
round-trip min/avg/max/stddev = 55.620/65.600/85.213/9.073 ms
Пинг примерно такой как и должен быть до Германии.
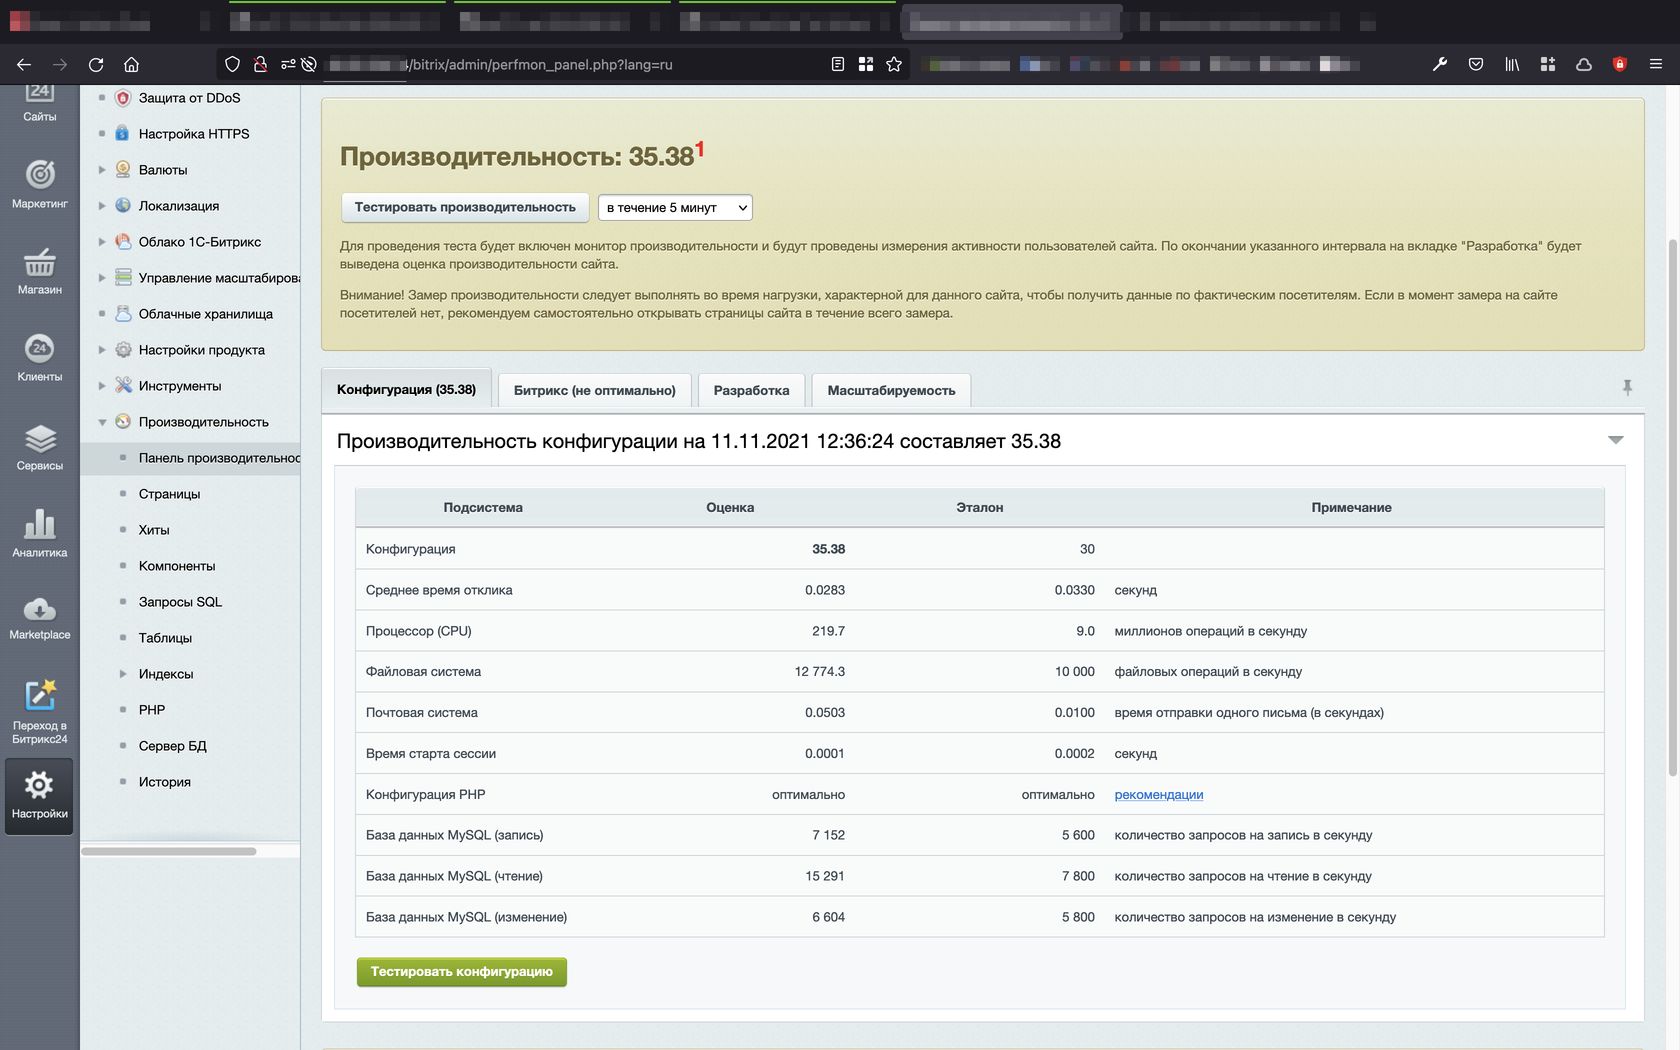
Битрикс попугаи
Из интереса решил установить bitrix_env и Битрикс: Бизнес. В результате получилось 35 битрикс-попугаев.
Общее впечатление
Работает все довольно шустро. За это мне и нравится Hetzner. Отличные сервера за свои деньги.
Локация US
Сведения о VM
CPX11 2 cpu 2GB 40GB SSD
На сервере установлена CentOS 7.9
cat /etc/centos-release
-----------
CentOS Linux release 7.9.2009 (Core)

Kernel info:
====================================================
uname -a
-----------
Linux us 3.10.0-1160.45.1.el7.x86_64 #1 SMP Wed Oct 13 17:20:51 UTC 2021 x86_64 x86_64 x86_64 GNU/Linux
Inxi
inxi -b
-----------
System:    Host: us Kernel: 3.10.0-1160.45.1.el7.x86_64 x86_64 bits: 64 Console: tty pts/0
           Distro: CentOS Linux release 7.9.2009 (Core)
Machine:   Type: Kvm System: Hetzner product: vServer v: 20171111 serial: 15918652
           Mobo: N/A model: N/A serial: N/A BIOS: Hetzner v: 20171111 date: 11/11/2017
CPU:       Info: Dual Core (4-Die) AMD EPYC [MCP MCM] speed: 2445 MHz
Graphics:  Device-1: Red Hat Virtio GPU driver: virtio-pci v: 1
           Display: server: No display server data found. Headless machine? tty: 160x48
           Message: Unable to show advanced data. Required tool glxinfo missing.
Network:   Device-1: Red Hat Virtio network driver: virtio-pci
Drives:    Local Storage: total: 38.15 GiB used: 1.21 GiB (3.2%)
Info:      Processes: 88 Uptime: 7m Memory: 1.75 GiB used: 281.4 MiB (15.7%) Init: systemd runlevel: 3 Shell: Bash
           inxi: 3.3.06
PT Summary
pt-summary
-----------
# Percona Toolkit System Summary Report ######################
        Date | 2021-11-11 12:11:32 UTC (local TZ: CET +0100)
    Hostname | us
      Uptime | 7 min,  1 user,  load average: 0.22, 0.10, 0.04
      System | Hetzner; vServer; v20171111 (Other)
 Service Tag | 15918652
    Platform | Linux
     Release | CentOS Linux release 7.9.2009 (Core)
      Kernel | 3.10.0-1160.45.1.el7.x86_64
Architecture | CPU = 64-bit, OS = 64-bit
   Threading | NPTL 2.17
     SELinux | Permissive
 Virtualized | VMWare
# Processor ##################################################
  Processors | physical = 1, cores = 2, virtual = 2, hyperthreading = no
      Speeds | 2x2445.406
      Models | 2xAMD EPYC Processor
      Caches | 2x512 KB
# Memory #####################################################
       Total | 1.7G
        Free | 1.1G
        Used | physical = 106.5M, swap allocated = 0.0, swap used = 0.0, virtual = 106.5M
      Shared | 8.6M
     Buffers | 28.7M
      Caches | 570.5M
       Dirty | 68936 kB
     UsedRSS | 105.3M
  Swappiness | 30
 DirtyPolicy | 30, 10
 DirtyStatus | 0, 0
  Locator   Size     Speed             Form Factor   Type          Type Detail
  ========= ======== ================= ============= ============= ===========
  DIMM 0    2000 MB  Unknown           DIMM          RAM           Other
# Mounted Filesystems ########################################
  Filesystem  Size Used Type     Opts                                                      Mountpoint
  /dev/sda1    38G   4% ext4     rw,relatime,seclabel,data=ordered                         /
  devtmpfs    871M   0% devtmpfs rw,nosuid,seclabel,size=891712k,nr_inodes=222928,mode=755 /dev
  tmpfs       179M   0% tmpfs    rw,nosuid,nodev,seclabel                                  /run/user/0
  tmpfs       179M   0% tmpfs    rw,nosuid,nodev,seclabel,mode=755                         /run/user/0
  tmpfs       179M   0% tmpfs    rw,nosuid,nodev,relatime,seclabel,size=183272k,mode=700   /run/user/0
  tmpfs       179M   0% tmpfs    ro,nosuid,nodev,noexec,seclabel,mode=755                  /run/user/0
  tmpfs       895M   0% tmpfs    rw,nosuid,nodev,seclabel                                  /dev/shm
  tmpfs       895M   0% tmpfs    rw,nosuid,nodev,seclabel,mode=755                         /dev/shm
  tmpfs       895M   0% tmpfs    rw,nosuid,nodev,relatime,seclabel,size=183272k,mode=700   /dev/shm
  tmpfs       895M   0% tmpfs    ro,nosuid,nodev,noexec,seclabel,mode=755                  /dev/shm
  tmpfs       895M   0% tmpfs    rw,nosuid,nodev,seclabel                                  /sys/fs/cgroup
  tmpfs       895M   0% tmpfs    rw,nosuid,nodev,seclabel,mode=755                         /sys/fs/cgroup
  tmpfs       895M   0% tmpfs    rw,nosuid,nodev,relatime,seclabel,size=183272k,mode=700   /sys/fs/cgroup
  tmpfs       895M   0% tmpfs    ro,nosuid,nodev,noexec,seclabel,mode=755                  /sys/fs/cgroup
  tmpfs       895M   1% tmpfs    rw,nosuid,nodev,seclabel                                  /run
  tmpfs       895M   1% tmpfs    rw,nosuid,nodev,seclabel,mode=755                         /run
  tmpfs       895M   1% tmpfs    rw,nosuid,nodev,relatime,seclabel,size=183272k,mode=700   /run
  tmpfs       895M   1% tmpfs    ro,nosuid,nodev,noexec,seclabel,mode=755                  /run
# Disk Schedulers And Queue Size #############################
         sda | [deadline] 128
         sr0 | [deadline] 128
# Disk Partioning ############################################
Device       Type      Start        End               Size
============ ==== ========== ========== ==================
/dev/sda     Disk                              40961572864
/dev/sda1    Part       2048   80003038        40960506880
# Kernel Inode State #########################################
dentry-state | 37812	26073	45	0	10339	0
     file-nr | 832	0	174866
    inode-nr | 25959	359
# LVM Volumes ################################################
Unable to collect information
# LVM Volume Groups ##########################################
Unable to collect information
# RAID Controller ############################################
  Controller | No RAID controller detected
# Network Config #############################################
  Controller | Red Hat, Inc. Virtio network device (rev 01)
 FIN Timeout | 60
  Port Range | 60999
# Interface Statistics #######################################
  interface  rx_bytes rx_packets  rx_errors   tx_bytes tx_packets  tx_errors
  ========= ========= ========== ========== ========== ========== ==========
  lo                0          0          0          0          0          0
  eth0       80000000      60000          0    1500000      10000          0
# Network Devices ############################################
  Device    Speed     Duplex
  ========= ========= =========
  eth0
# Network Connections ########################################
  Connections from remote IP addresses
    2a00                2
    5.83.xx.xx          1
  Connections to local IP addresses
    2a01                2
  Connections to top 10 local ports
    47572               1
    49938               1
    4ff:f0:1089::46666     1
    4ff:f0:1089::46668     1
    51536               1
    55292               1
    55296               1
    58892               1
    59526               1
    60074               1
  States of connections
    ESTABLISHED         1
    LISTEN              2
    TIME_WAIT          15
# Top Processes ##############################################
  PID USER      PR  NI    VIRT    RES    SHR S  %CPU %MEM     TIME+ COMMAND
    1 root      20   0  193688   6816   4224 S   0.0  0.4   0:02.33 systemd
    2 root      20   0       0      0      0 S   0.0  0.0   0:00.00 kthreadd
    4 root       0 -20       0      0      0 S   0.0  0.0   0:00.00 kworker/0:+
    6 root      20   0       0      0      0 S   0.0  0.0   0:00.02 ksoftirqd/0
    7 root      rt   0       0      0      0 S   0.0  0.0   0:00.00 migration/0
    8 root      20   0       0      0      0 S   0.0  0.0   0:00.00 rcu_bh
    9 root      20   0       0      0      0 S   0.0  0.0   0:00.18 rcu_sched
   10 root       0 -20       0      0      0 S   0.0  0.0   0:00.00 lru-add-dr+
   11 root      rt   0       0      0      0 S   0.0  0.0   0:00.00 watchdog/0
# Notable Processes ##########################################
  PID    OOM    COMMAND
 1208    -17    sshd
# Simplified and fuzzy rounded vmstat (wait please) ##########
  procs  ---swap-- -----io---- ---system---- --------cpu--------
   r  b    si   so    bi    bo     ir     cs  us  sy  il  wa  st
   1  0     0    0   225   400    150    150   3   1  95   0   0
   0  0     0    0   100     0   1000   1250   4   7  90   0   0
   0  0     0    0     0 35000    225     80   0   1 100   0   0
   0  0     0    0     0     0     60     90   0   0 100   0   0
   0  0     0    0     0     0     60    100   0   0 100   0   0
# Memory mamagement ##########################################
Transparent huge pages are enabled.
# The End ####################################################
Тесты
Диск
DD
dd if=/dev/zero of=test bs=64k count=16k conv=fdatasync 2>&1
rm -f test
-----------
16384+0 records in
16384+0 records out
1073741824 bytes (1.1 GB) copied, 0.770746 s, 1.4 GB/s
16384+0 records in
16384+0 records out
1073741824 bytes (1.1 GB) copied, 0.694117 s, 1.5 GB/s
16384+0 records in
16384+0 records out
1073741824 bytes (1.1 GB) copied, 0.662033 s, 1.6 GB/s
Здесь скорость линейной записи выше в полтора раза чем на сервере в локации DE и в 2 раза выше чем у сервера в VDSina.
Sysbench тест диска
Подготавливаем тестовые файлы.
sysbench fileio --file-total-size=2G prepare
-----------
sysbench 1.0.17 (using system LuaJIT 2.0.4)

128 files, 16384Kb each, 2048Mb total
Creating files for the test...
Extra file open flags: (none)
Creating file test_file.0
...
Creating file test_file.127
2147483648 bytes written in 2.26 seconds (905.20 MiB/sec).
sysbench fileio --file-total-size=2G --file-test-mode=rndrw --time=300 --max-requests=0 run
Запускаем тест
sysbench fileio --file-total-size=2G --file-test-mode=rndrw --time=300 --max-requests=0 run
-----------
sysbench 1.0.17 (using system LuaJIT 2.0.4)

Running the test with following options:
Number of threads: 1
Initializing random number generator from current time


Extra file open flags: (none)
128 files, 16MiB each
2GiB total file size
Block size 16KiB
Number of IO requests: 0
Read/Write ratio for combined random IO test: 1.50
Periodic FSYNC enabled, calling fsync() each 100 requests.
Calling fsync() at the end of test, Enabled.
Using synchronous I/O mode
Doing random r/w test
Initializing worker threads...

Threads started!


File operations:
    reads/s:                      2922.57
    writes/s:                     1948.38
    fsyncs/s:                     6235.02

Throughput:
    read, MiB/s:                  45.67
    written, MiB/s:               30.44

General statistics:
    total time:                          300.0132s
    total number of events:              3331927

Latency (ms):
         min:                                    0.00
         avg:                                    0.09
         max:                                   65.24
         95th percentile:                        0.28
         sum:                               298652.46

Threads fairness:
    events (avg/stddev):           3331927.0000/0.00
    execution time (avg/stddev):   298.6525/0.00
Процессор
Sysbench CPU:
====================================================
sysbench cpu --cpu-max-prime=20000 --num-threads=1 run
-----------
sysbench 1.0.17 (using system LuaJIT 2.0.4)

Running the test with following options:
Number of threads: 1
Initializing random number generator from current time


Prime numbers limit: 20000

Initializing worker threads...

Threads started!

CPU speed:
    events per second:  1223.72

General statistics:
    total time:                          10.0004s
    total number of events:              12240

Latency (ms):
         min:                                    0.68
         avg:                                    0.82
         max:                                    1.88
         95th percentile:                        1.25
         sum:                                 9997.13

Threads fairness:
    events (avg/stddev):           12240.0000/0.00
    execution time (avg/stddev):   9.9971/0.00
Sysbench CPU Mutex 64:
====================================================
sysbench mutex --threads=64 run
-----------
sysbench 1.0.17 (using system LuaJIT 2.0.4)

Running the test with following options:
Number of threads: 64
Initializing random number generator from current time


Initializing worker threads...

Threads started!


General statistics:
    total time:                          6.1516s
    total number of events:              64

Latency (ms):
         min:                                 4576.78
         avg:                                 5595.86
         max:                                 5966.44
         95th percentile:                     5918.87
         sum:                               358134.95

Threads fairness:
    events (avg/stddev):           1.0000/0.00
    execution time (avg/stddev):   5.5959/0.19
7-zip benchmark
7-zip benchmark:
====================================================
7za b
-----------

7-Zip (a) [64] 16.02 : Copyright (c) 1999-2016 Igor Pavlov : 2016-05-21
p7zip Version 16.02 (locale=en_US.UTF-8,Utf16=on,HugeFiles=on,64 bits,2 CPUs AMD EPYC Processor (830F10),ASM,AES-NI)

AMD EPYC Processor (830F10)
CPU Freq:  2215  2360  2357  2355  2358  2373  2374  2373  2359

RAM size:    1789 MB,  # CPU hardware threads:   2
RAM usage:    441 MB,  # Benchmark threads:      2

                       Compressing  |                  Decompressing
Dict     Speed Usage    R/U Rating  |      Speed Usage    R/U Rating
         KiB/s     %   MIPS   MIPS  |      KiB/s     %   MIPS   MIPS

22:       6117   175   3401   5951  |      72695   196   3168   6207
23:       7959   194   4185   8110  |      85941   199   3731   7439
24:       6828   192   3820   7342  |      83956   200   3687   7371
25:       7253   195   4250   8282  |      54282   187   2590   4831
----------------------------------  | ------------------------------
Avr:             189   3914   7421  |              195   3294   6462
Tot:             192   3604   6942
ОЗУ
Memory size for Sysbench Memory test: 1G
Disk space for Sysbench Disk test: 2G
Sysbench Memory test:
====================================================
sysbench memory --num-threads=4 --memory-total-size=1G run
-----------
WARNING: --num-threads is deprecated, use --threads instead
sysbench 1.0.17 (using system LuaJIT 2.0.4)

Running the test with following options:
Number of threads: 4
Initializing random number generator from current time


Running memory speed test with the following options:
  block size: 1KiB
  total size: 1024MiB
  operation: write
  scope: global

Initializing worker threads...

Threads started!

Total operations: 1048576 (2855340.01 per second)

1024.00 MiB transferred (2788.42 MiB/sec)


General statistics:
    total time:                          0.3663s
    total number of events:              1048576

Latency (ms):
         min:                                    0.00
         avg:                                    0.00
         max:                                   22.01
         95th percentile:                        0.00
         sum:                                  797.62

Threads fairness:
    events (avg/stddev):           262144.0000/0.00
    execution time (avg/stddev):   0.1994/0.05
Пинг из Ульяновска
➜ ping 5.161.49.135
PING 5.161.49.135 (5.161.49.135): 56 data bytes
64 bytes from 5.161.49.135: icmp_seq=0 ttl=51 time=147.821 ms
64 bytes from 5.161.49.135: icmp_seq=1 ttl=51 time=146.032 ms
64 bytes from 5.161.49.135: icmp_seq=2 ttl=51 time=140.052 ms
64 bytes from 5.161.49.135: icmp_seq=3 ttl=51 time=138.223 ms
64 bytes from 5.161.49.135: icmp_seq=4 ttl=51 time=145.342 ms
64 bytes from 5.161.49.135: icmp_seq=5 ttl=51 time=141.658 ms
64 bytes from 5.161.49.135: icmp_seq=6 ttl=51 time=139.122 ms
64 bytes from 5.161.49.135: icmp_seq=7 ttl=51 time=143.522 ms
64 bytes from 5.161.49.135: icmp_seq=8 ttl=51 time=139.070 ms
64 bytes from 5.161.49.135: icmp_seq=9 ttl=51 time=138.270 ms
^C
--- 5.161.49.135 ping statistics ---
10 packets transmitted, 10 packets received, 0.0% packet loss
round-trip min/avg/max/stddev = 138.223/141.911/147.821/3.354 ms
Битрикс попугаи
Тут попугаев замерить не получилось так как хоть bitrix_env и установился, но вот инсталлятор Битрикса не смог скачать дистрибутив. Видимо проблемы со связанностью сети в этой локации.
Общее впечатление
Для экономии времени я запустил создание серверов в обоих локациях и установку софта примерно в одно и то же время. Но на сервере который находится в Германии софт установился в разы быстрее.
Похоже что несмотря на отличное железо у серверов в этой локации все еще есть проблемы с сетью. Для проектов ориентированных на Россию и Европу этот вариант так себе. Возможно для проектов расчитанных на американскую аудиторию это будет более лучшее решение. И все же я надеюсь что сеть тут пофиксят.