![]()
Привет!
Честно говоря я не слышал ранее об этом хостинг-провайдере. Я узнал об этих ребятах когда представитель компании написал мне сообщение и любезно предложил дать серверы на тест.
Ну что ж, давайте посмотрим 😉
Регистрация

Сайт хостера удивил своим необычным современным дизайном. Выглядит все довольно необычно!
Регистрация тут тоже необычная – через отправку magic link на e-mail. Кроме e-mail меня при регистрации больше ни о чем не спросили. Удобно.
Правда письмо с magic link шло на яндексовский почтовый ящик довольно долго – где-то пару минут. Это можно записать в минус.
Панель управления
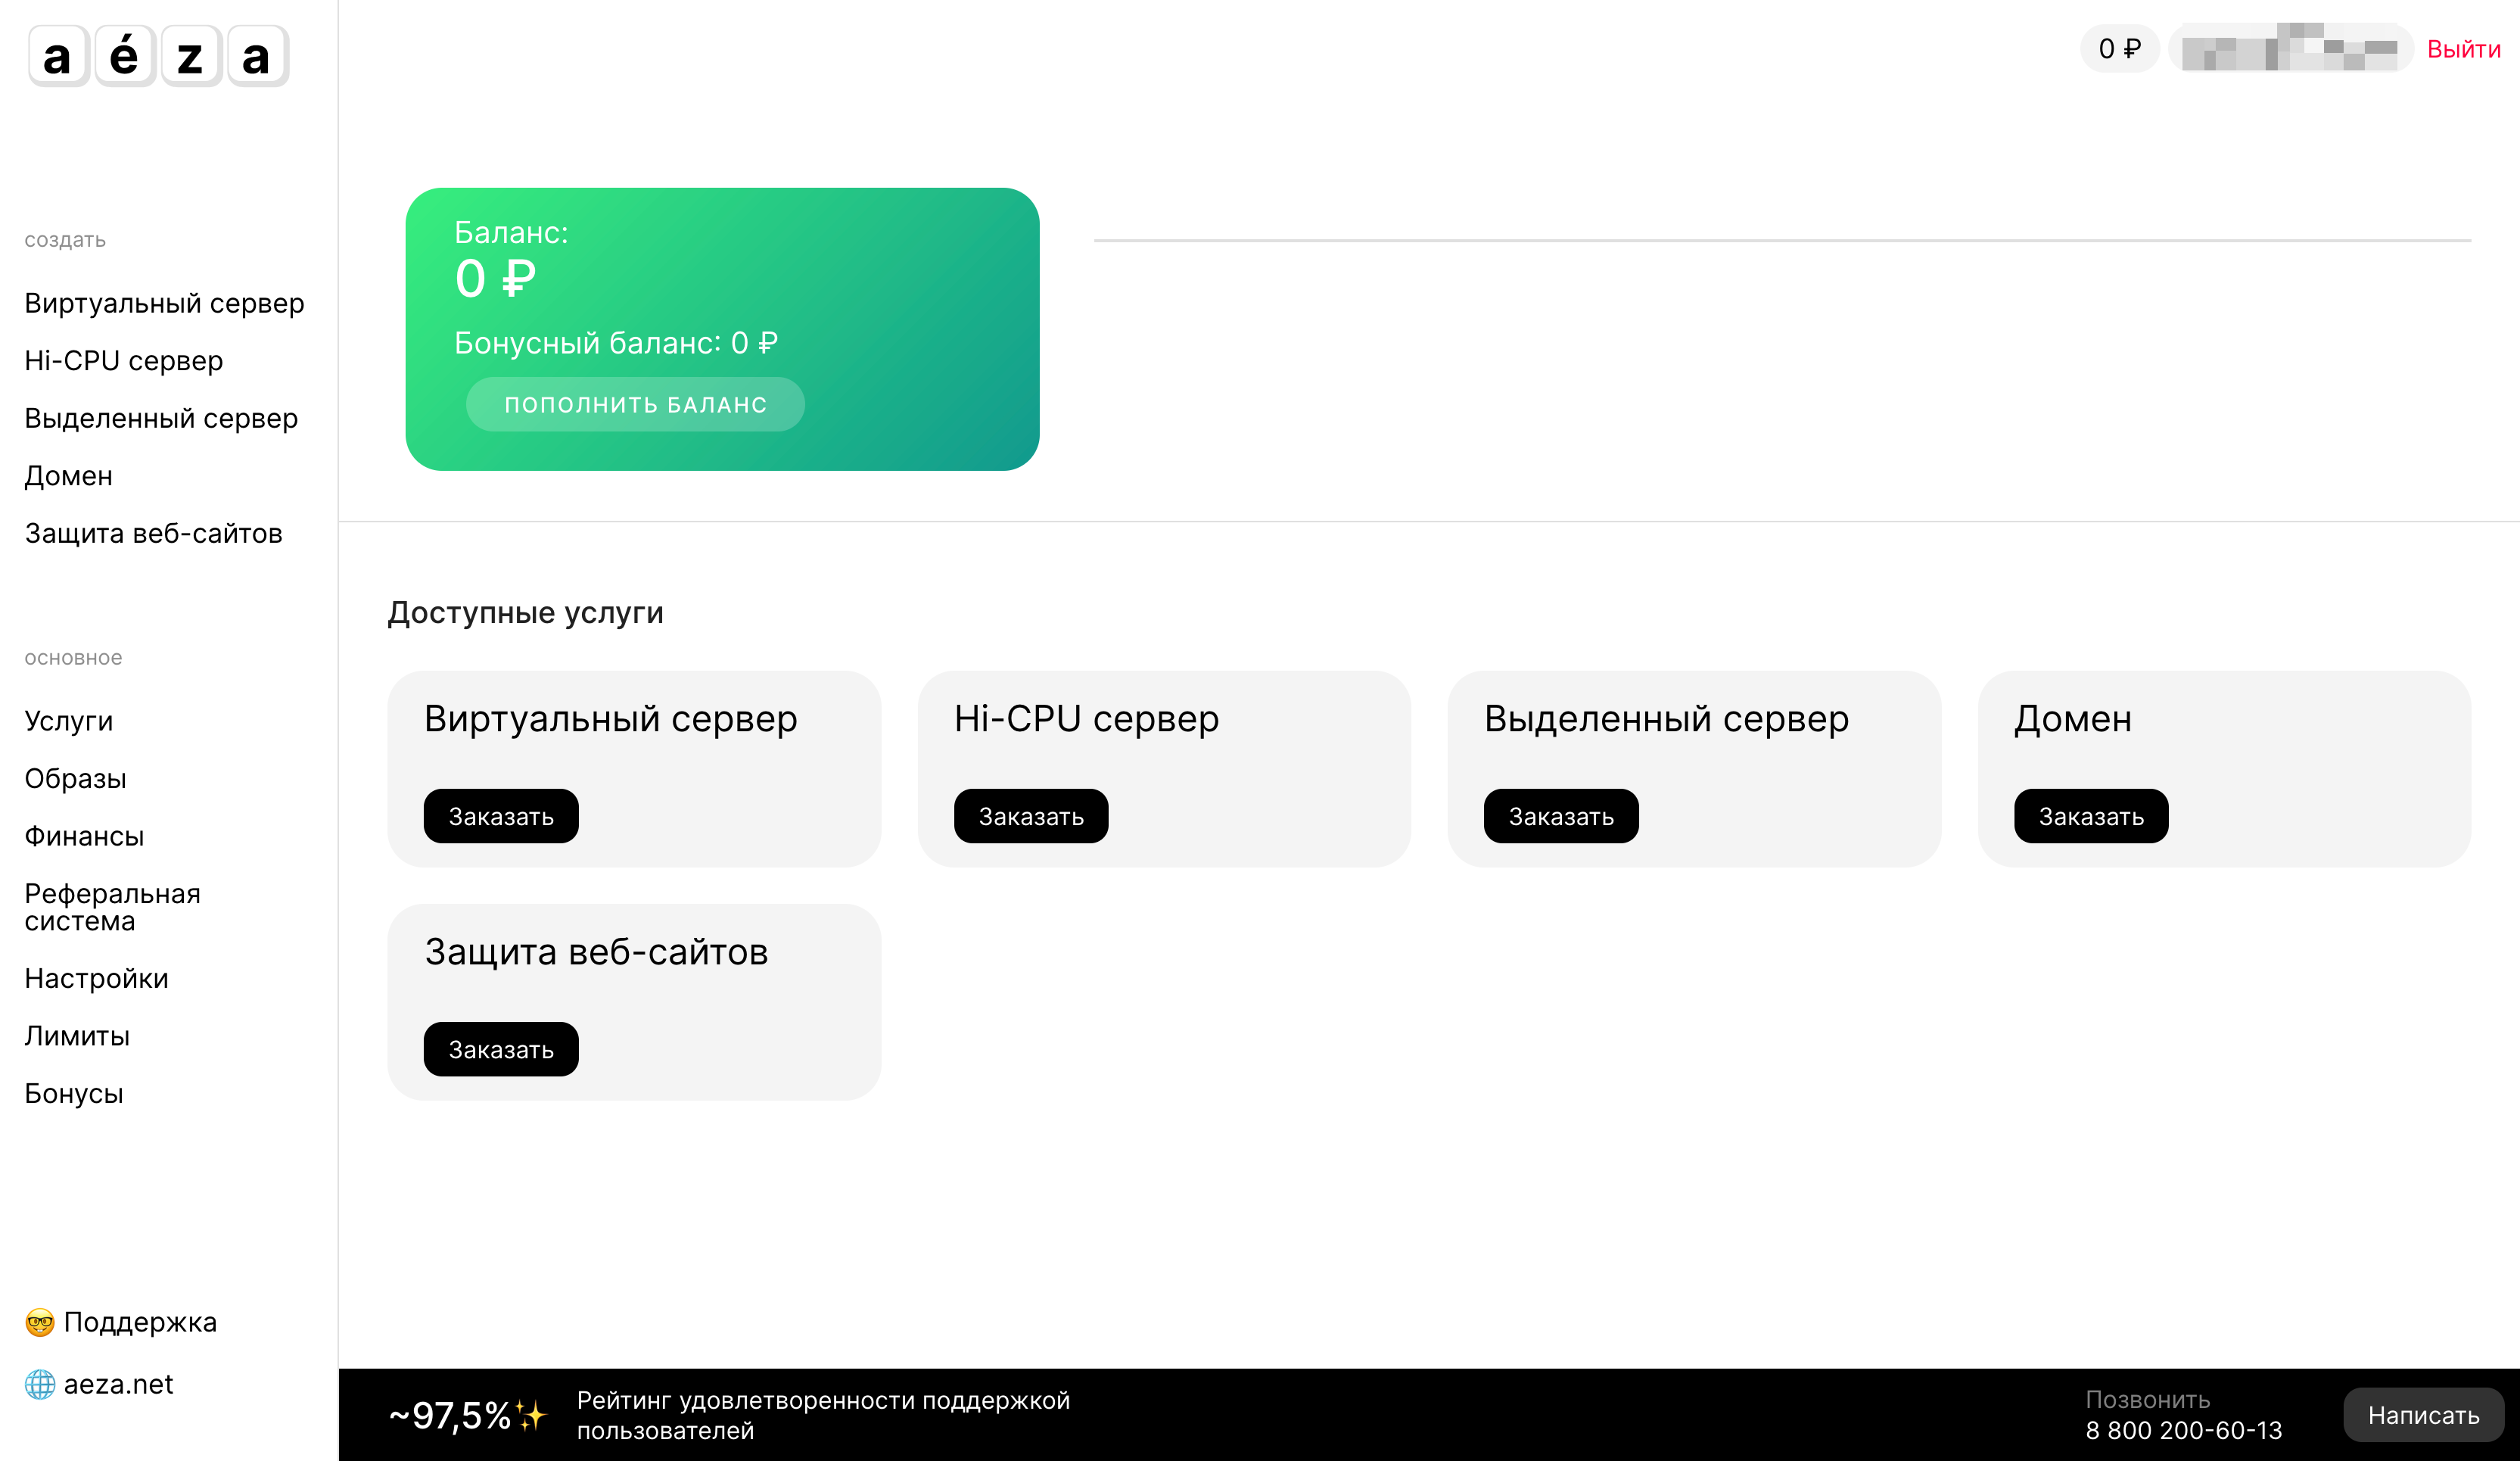
Итак, теперь давайте посмотрим на панель управления.
Услуги
Здесь мы видим небольшой список доступных услуг:
- аренда виртуального сервера
- аренда hi-cpu виртуального сервера
- аренда выделенного сервера
- регистрация доменов
- подключение AntiDDoS
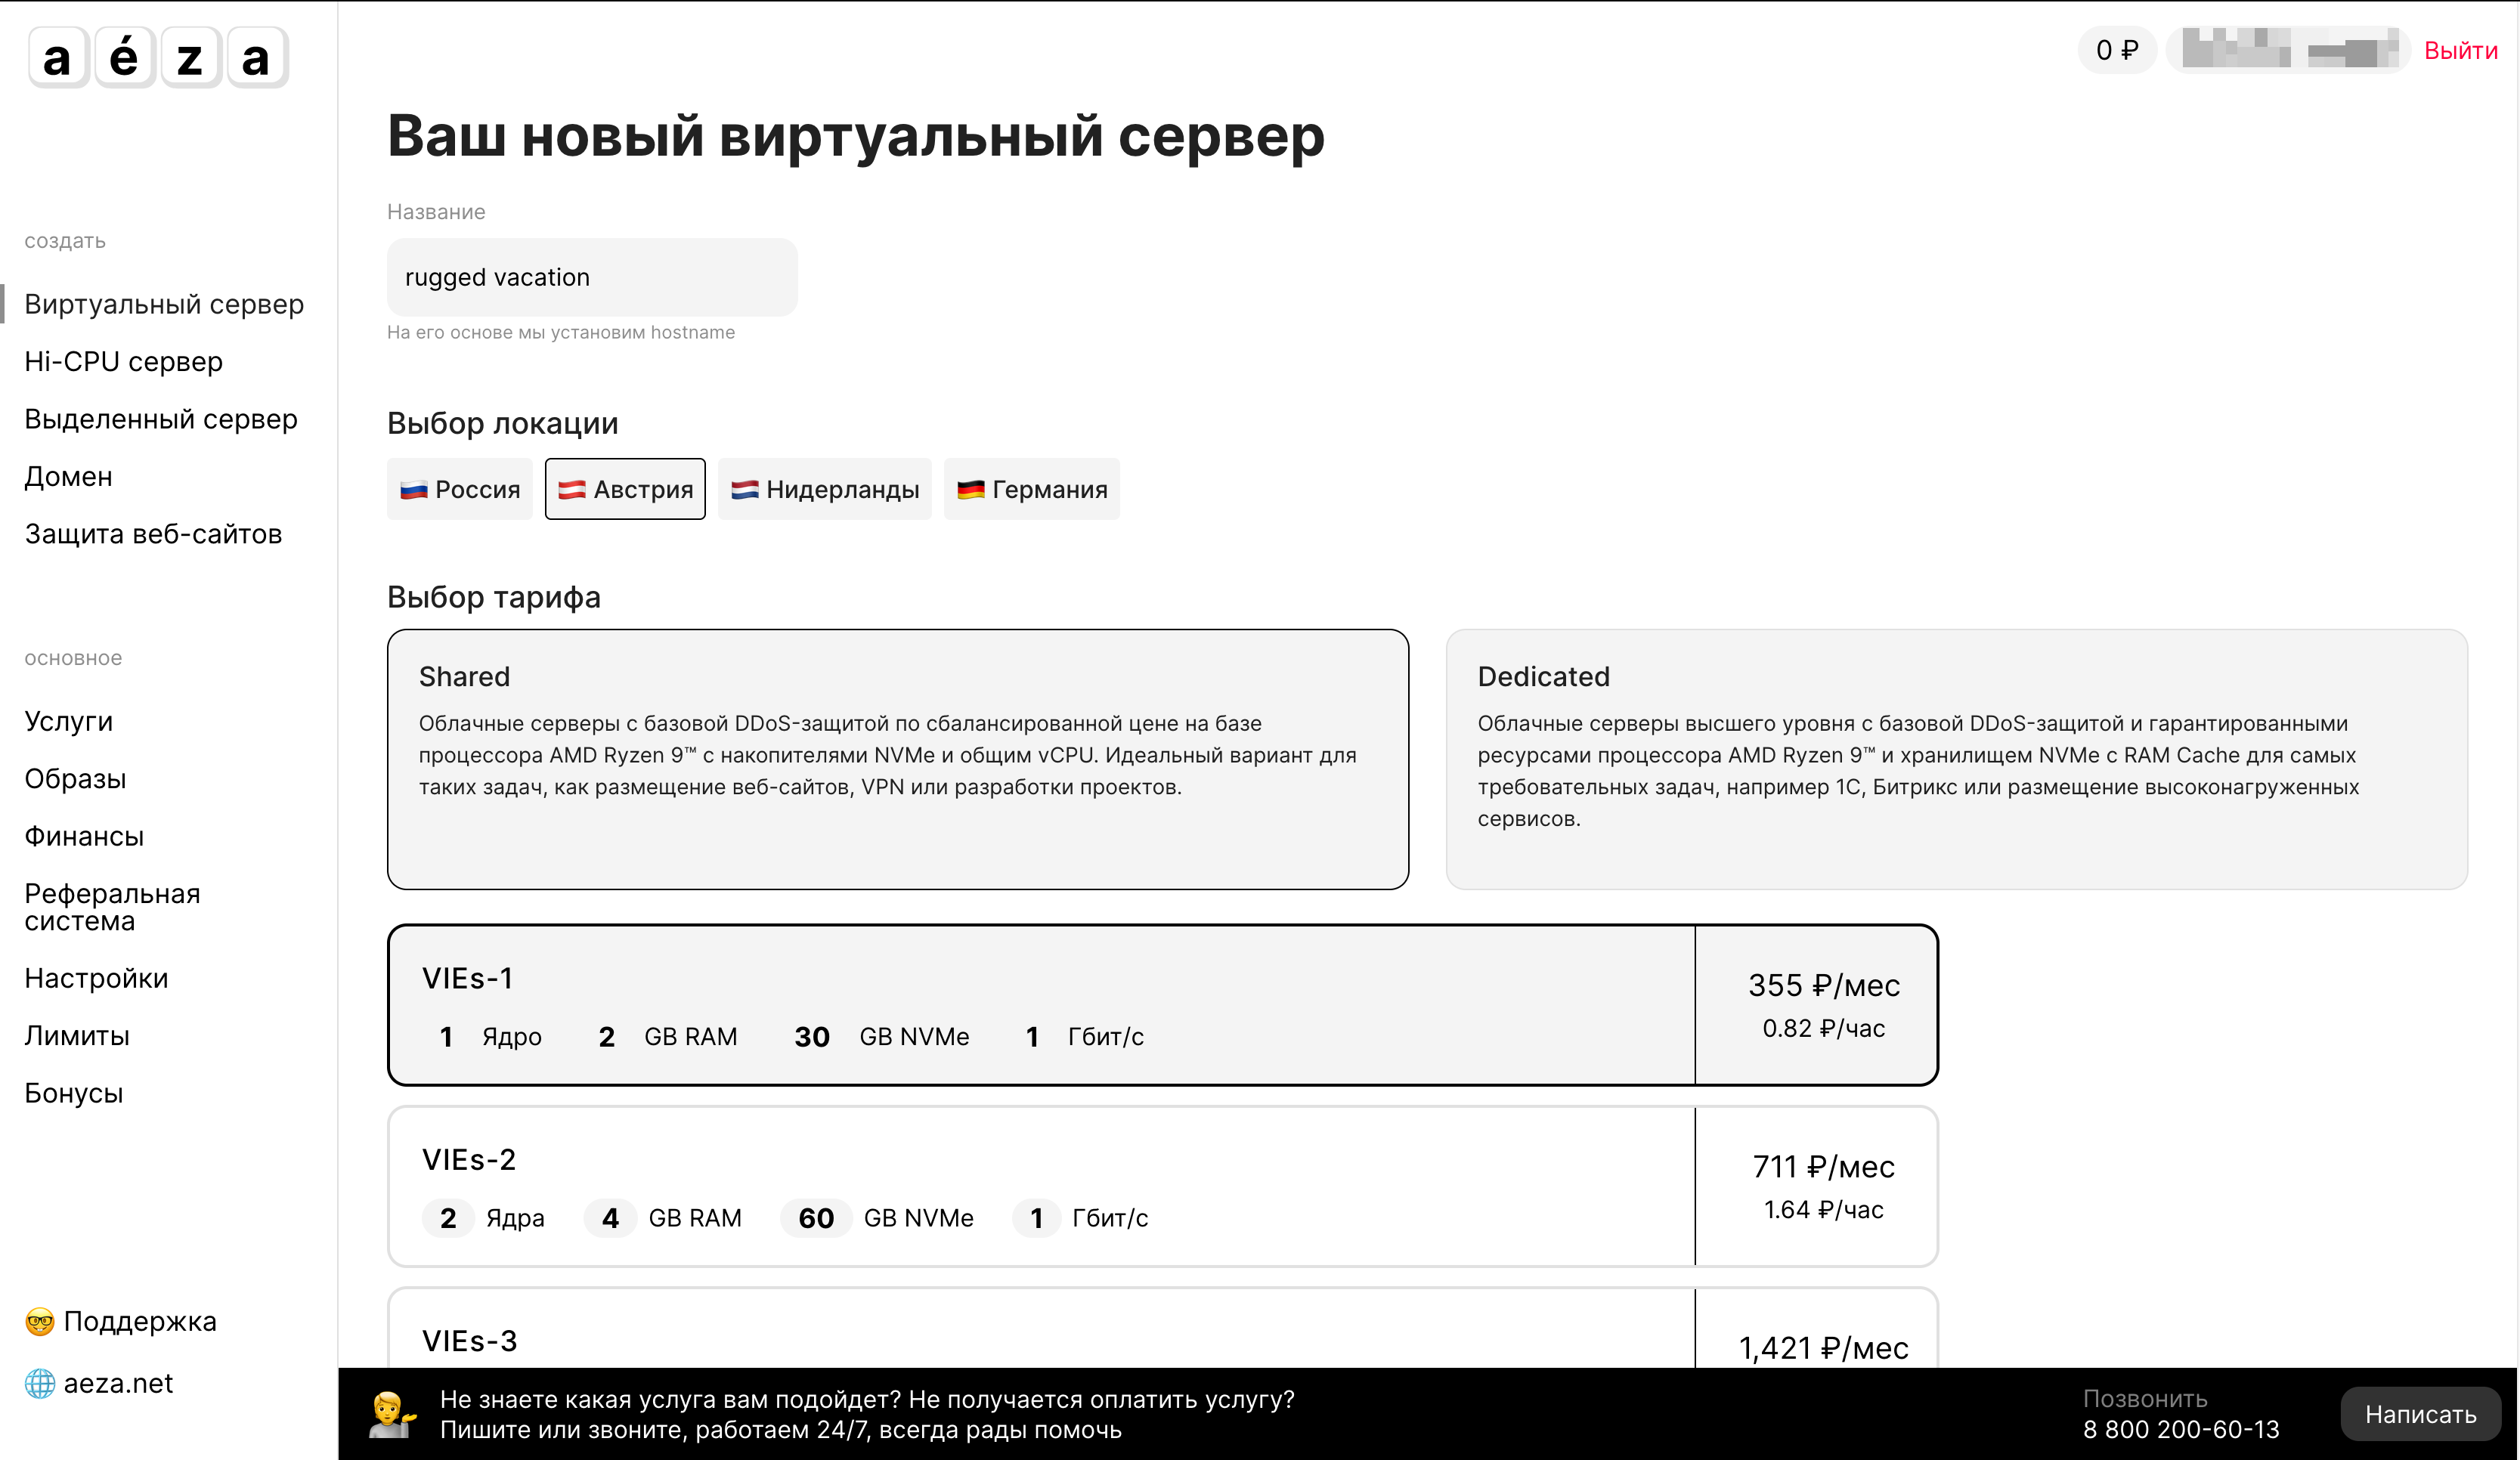
Локации и ресурсы
Здесь доступны 4 локации для аренды виртуального сервера - Россия, Австрия, Нидерланды и Германия. Виртуальные серверы доступны двух типов - с shared и dedicated CPU. Сервера все на базе AMD Ryzen 9.
Виртуальные сервера с Hi-CPU доступны только в локации РФ. Процессор - AMD Threadripper 3990X.
Выделенные сервера доступны в Москве, Варшаве, Фалькенштейне, Хельсинки и Гравлине.
Кстати, виртуальные сервера можно арендовать на час. Это удобно, я такой подход уже заценил в Hetzner Cloud.
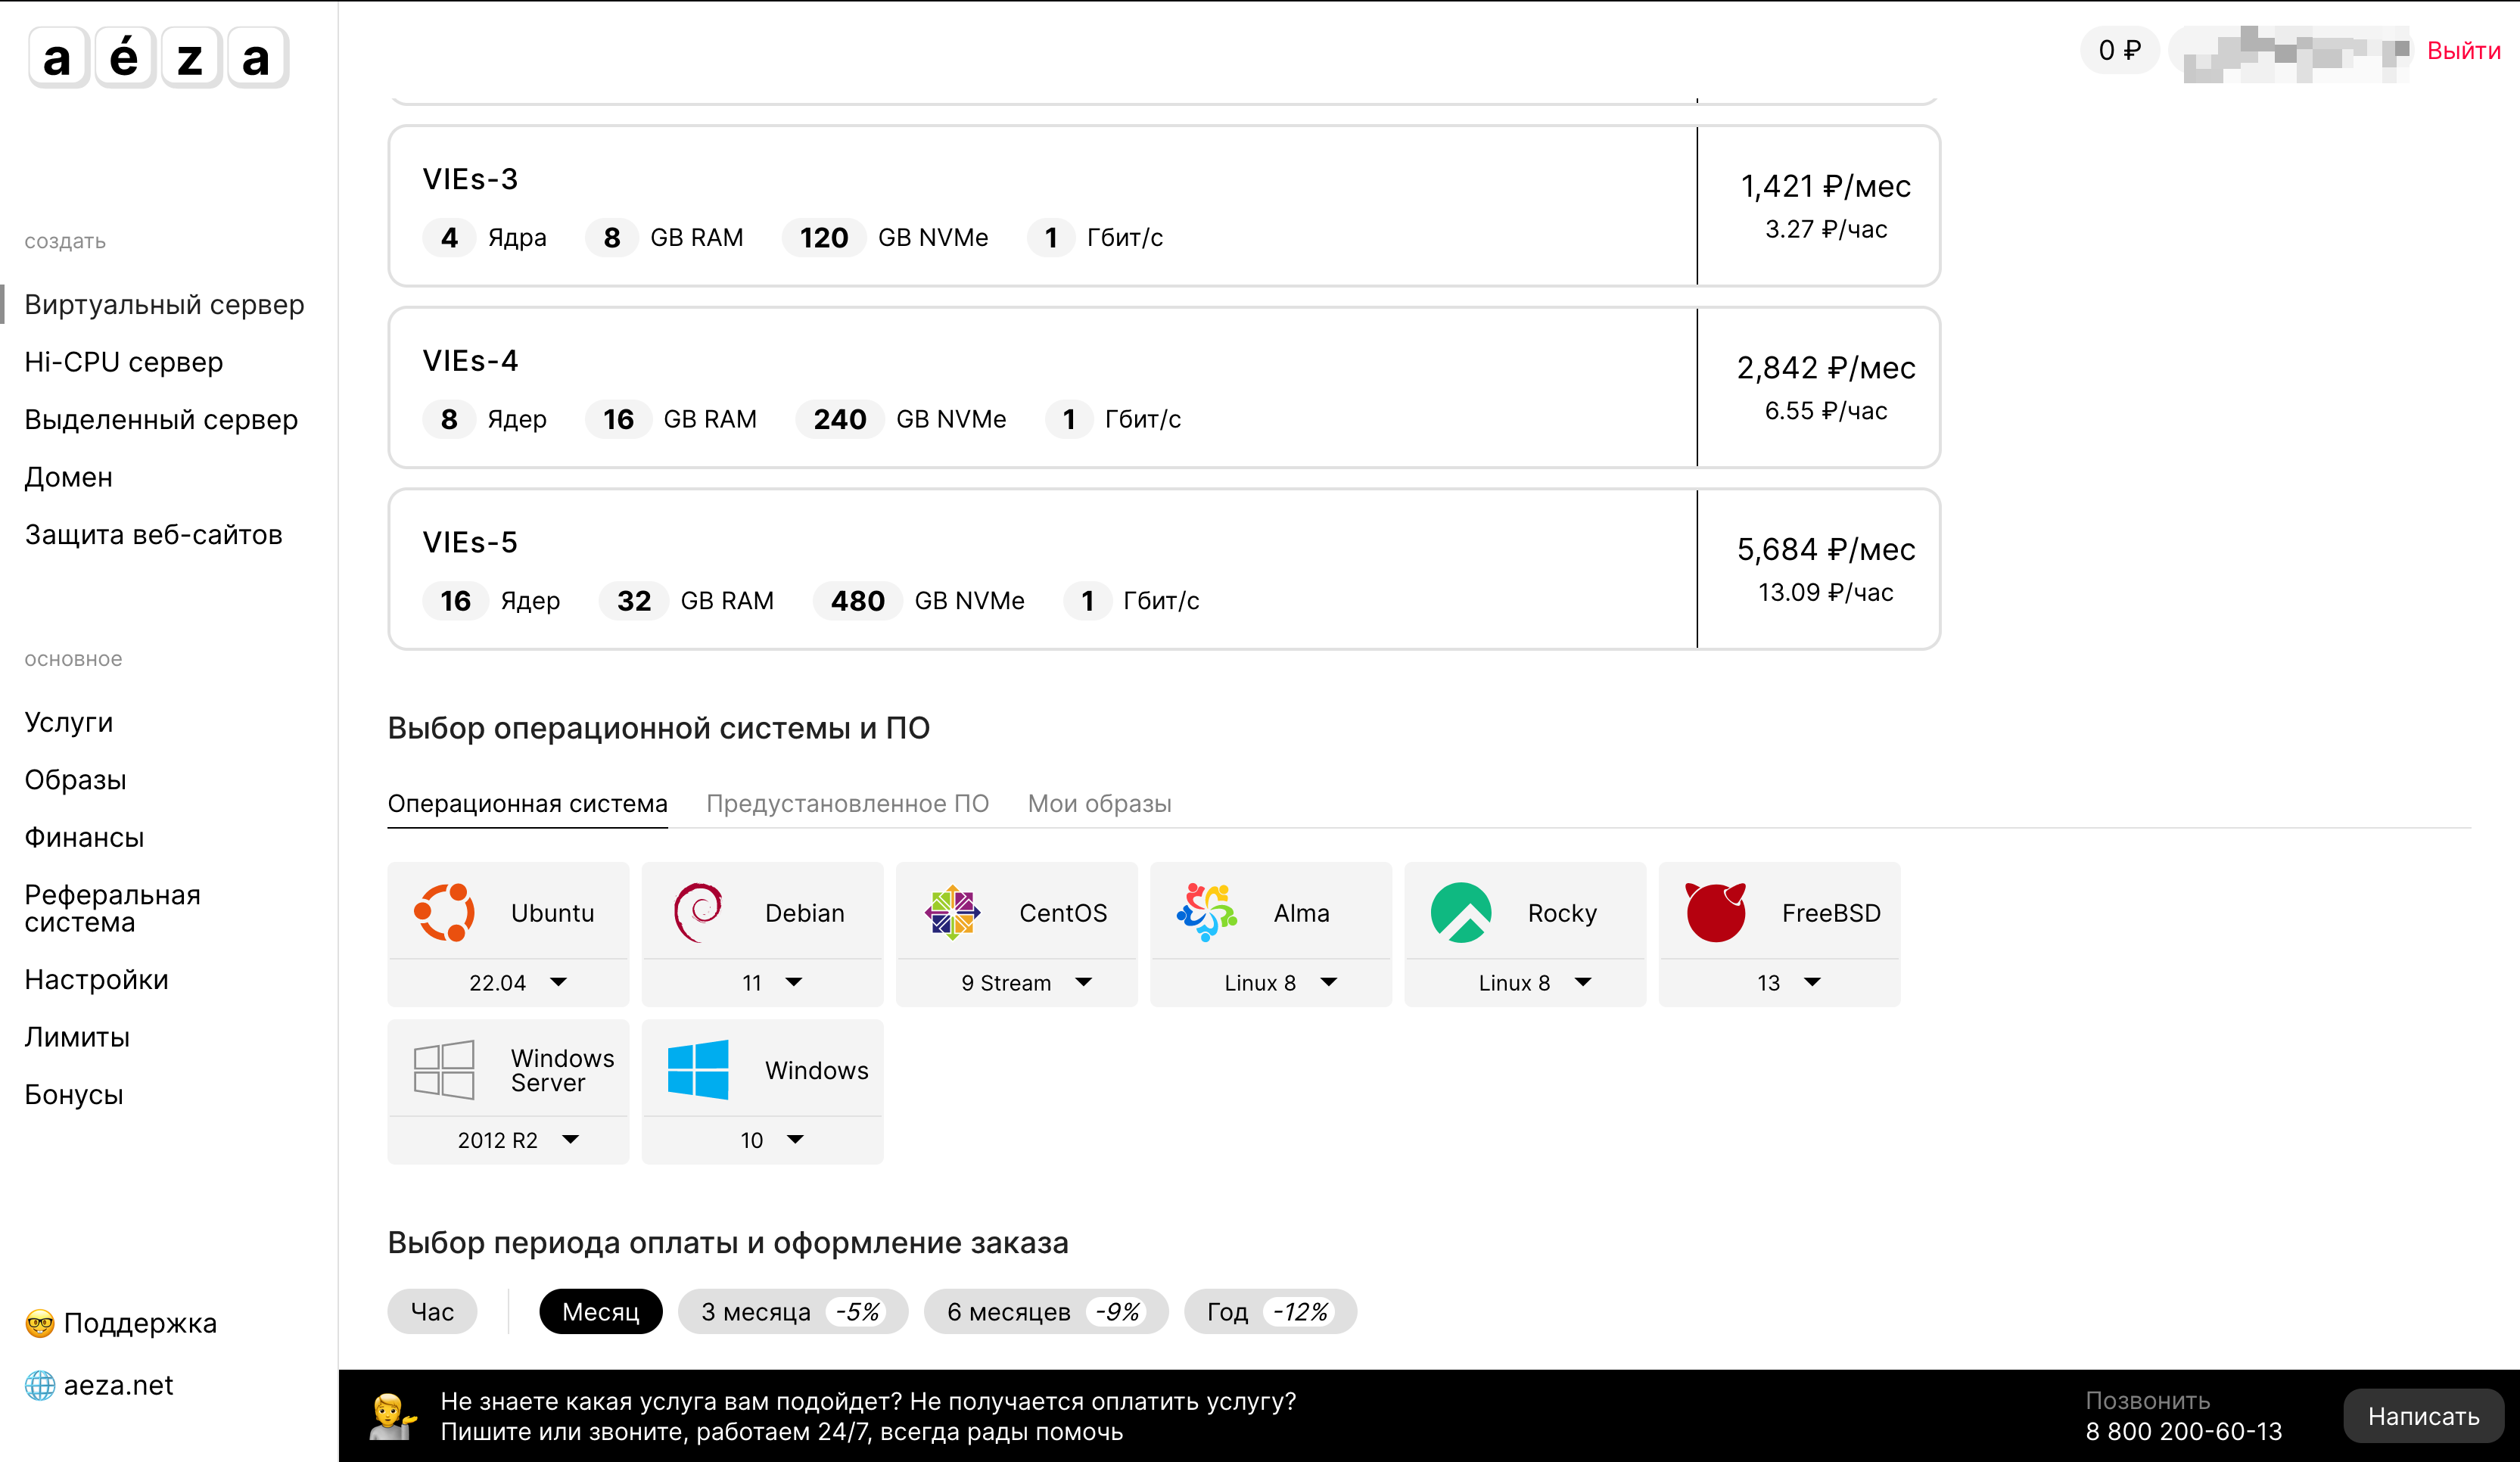
Операционные системы
Здесь нам доступны образы популярных дистрибутивов Linux, а также FreeBSD и Windows. Также есть чуть больше десятка образов с предустановленным ПО и есть возможность загрузить свой ISO-образ.
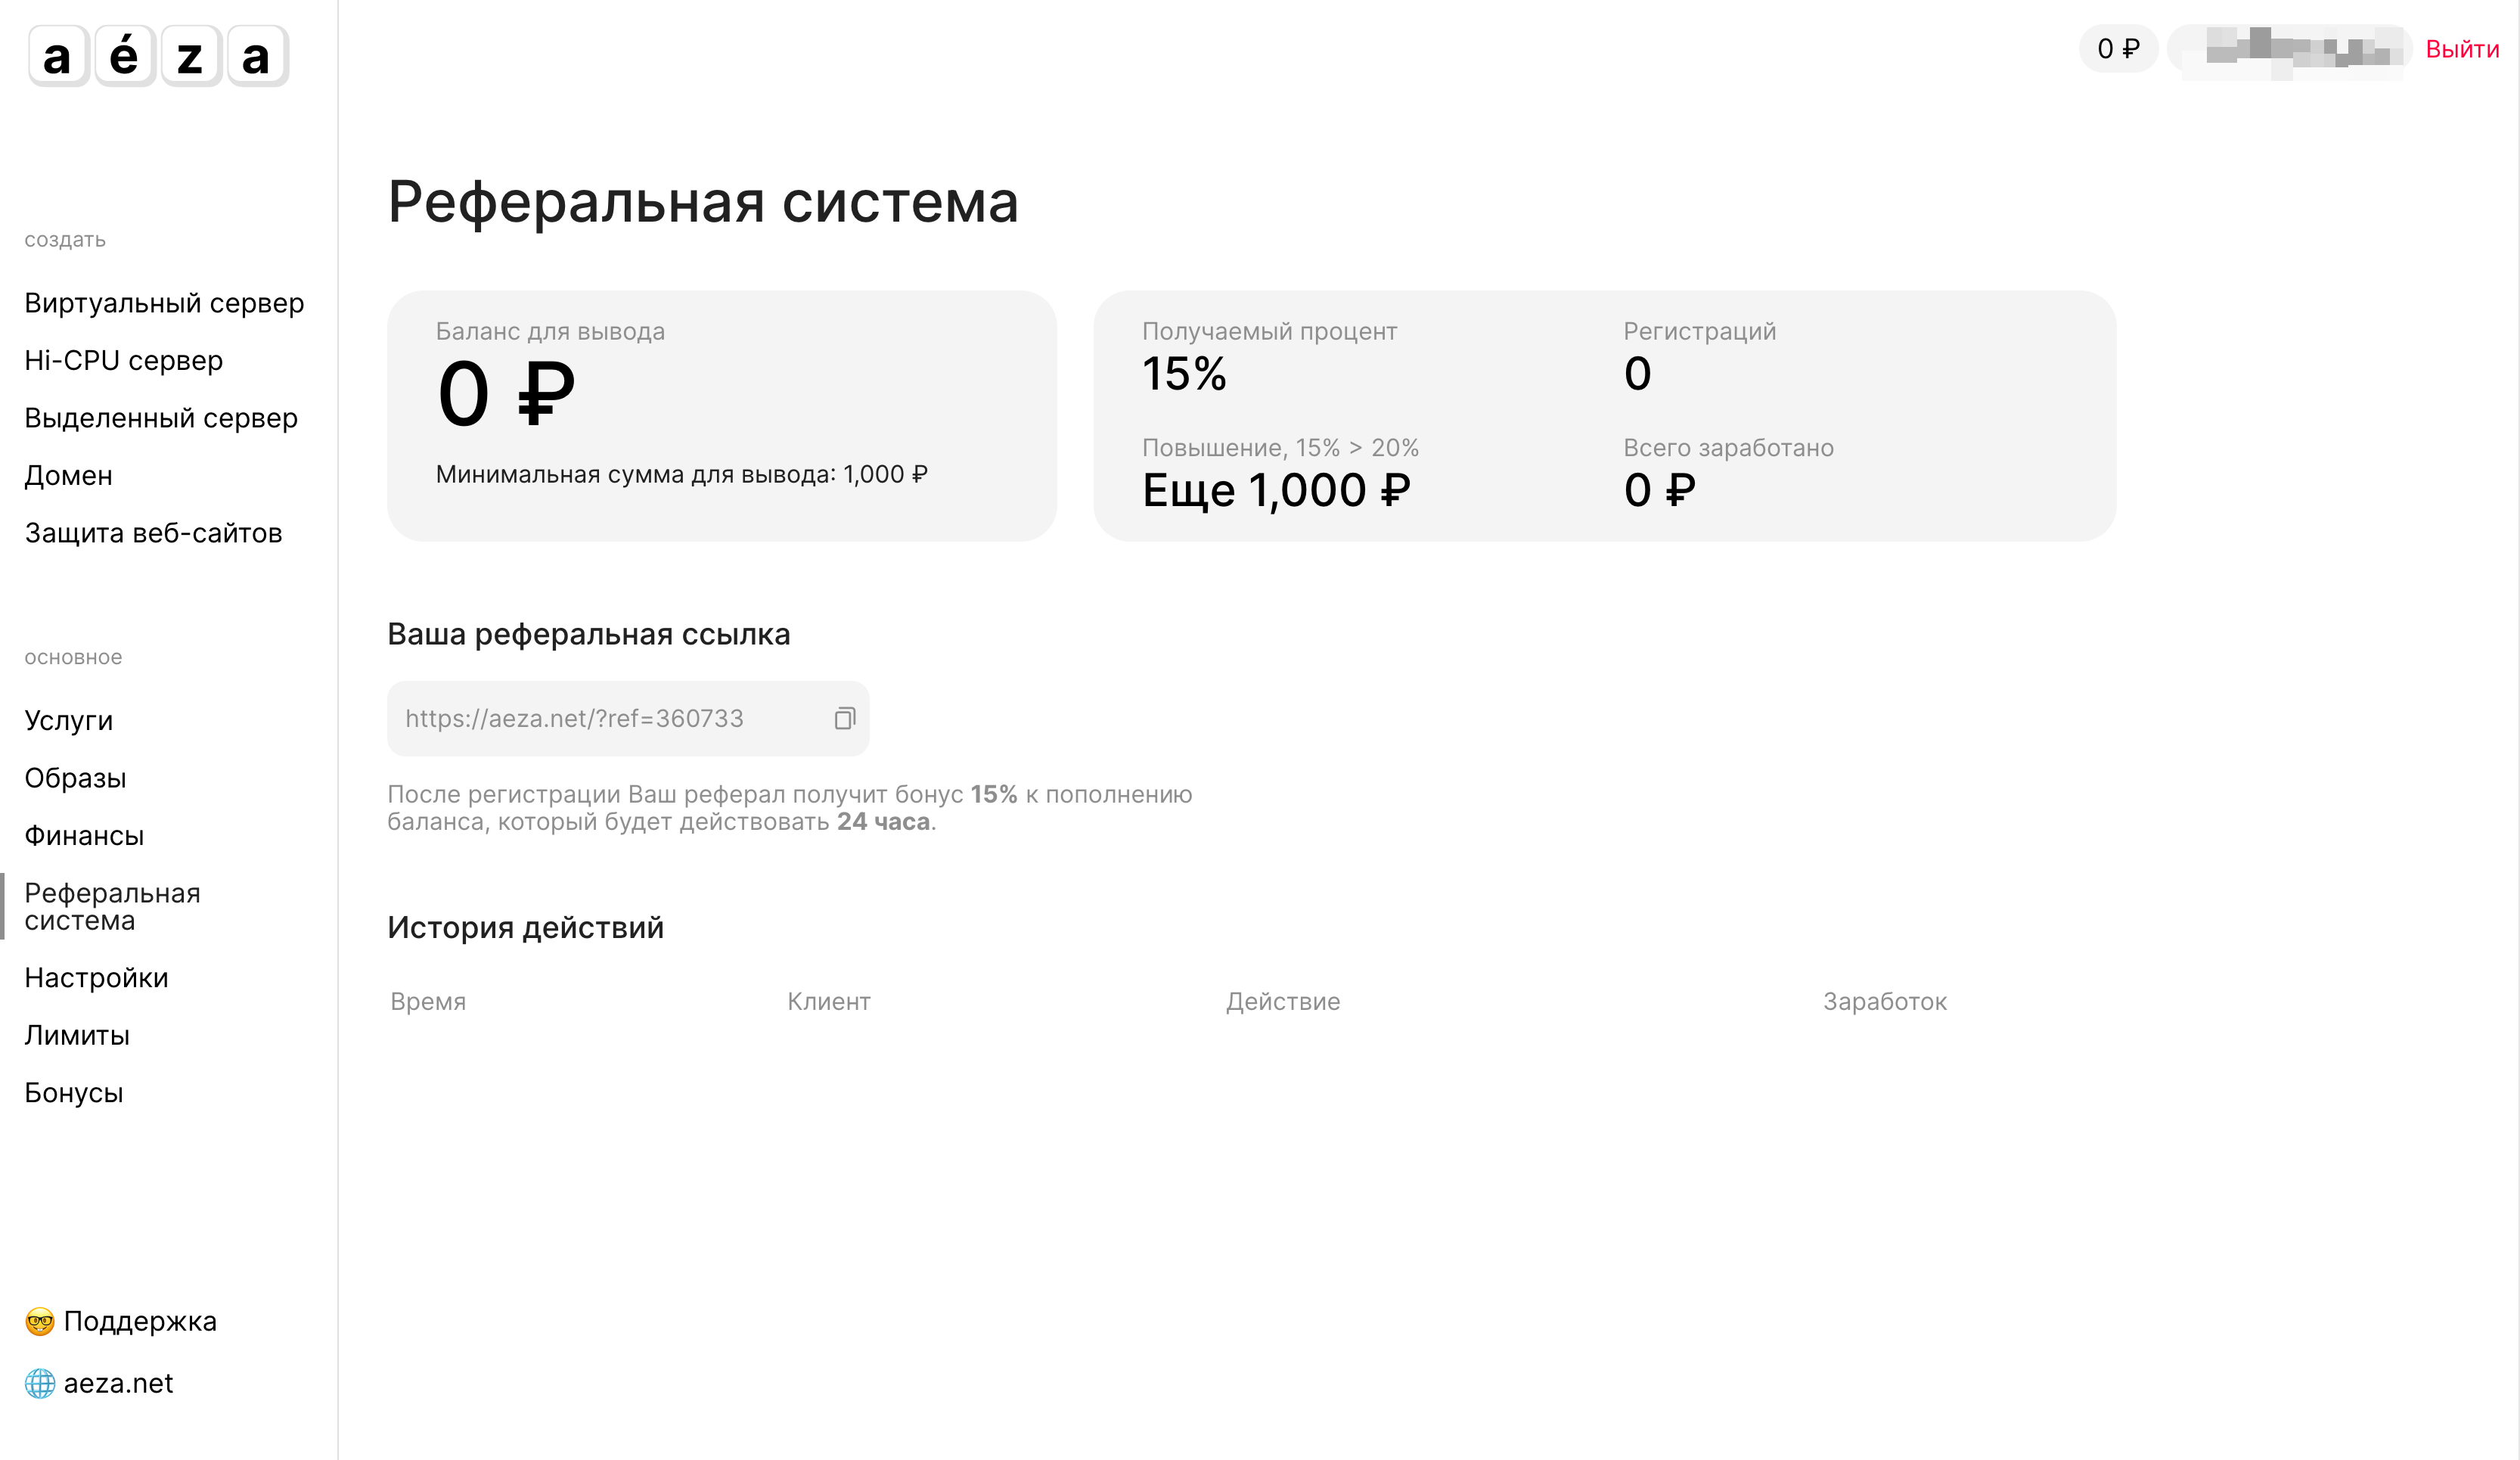
Финансы
Тут меня удивила возможность подключения «Овердрафта»
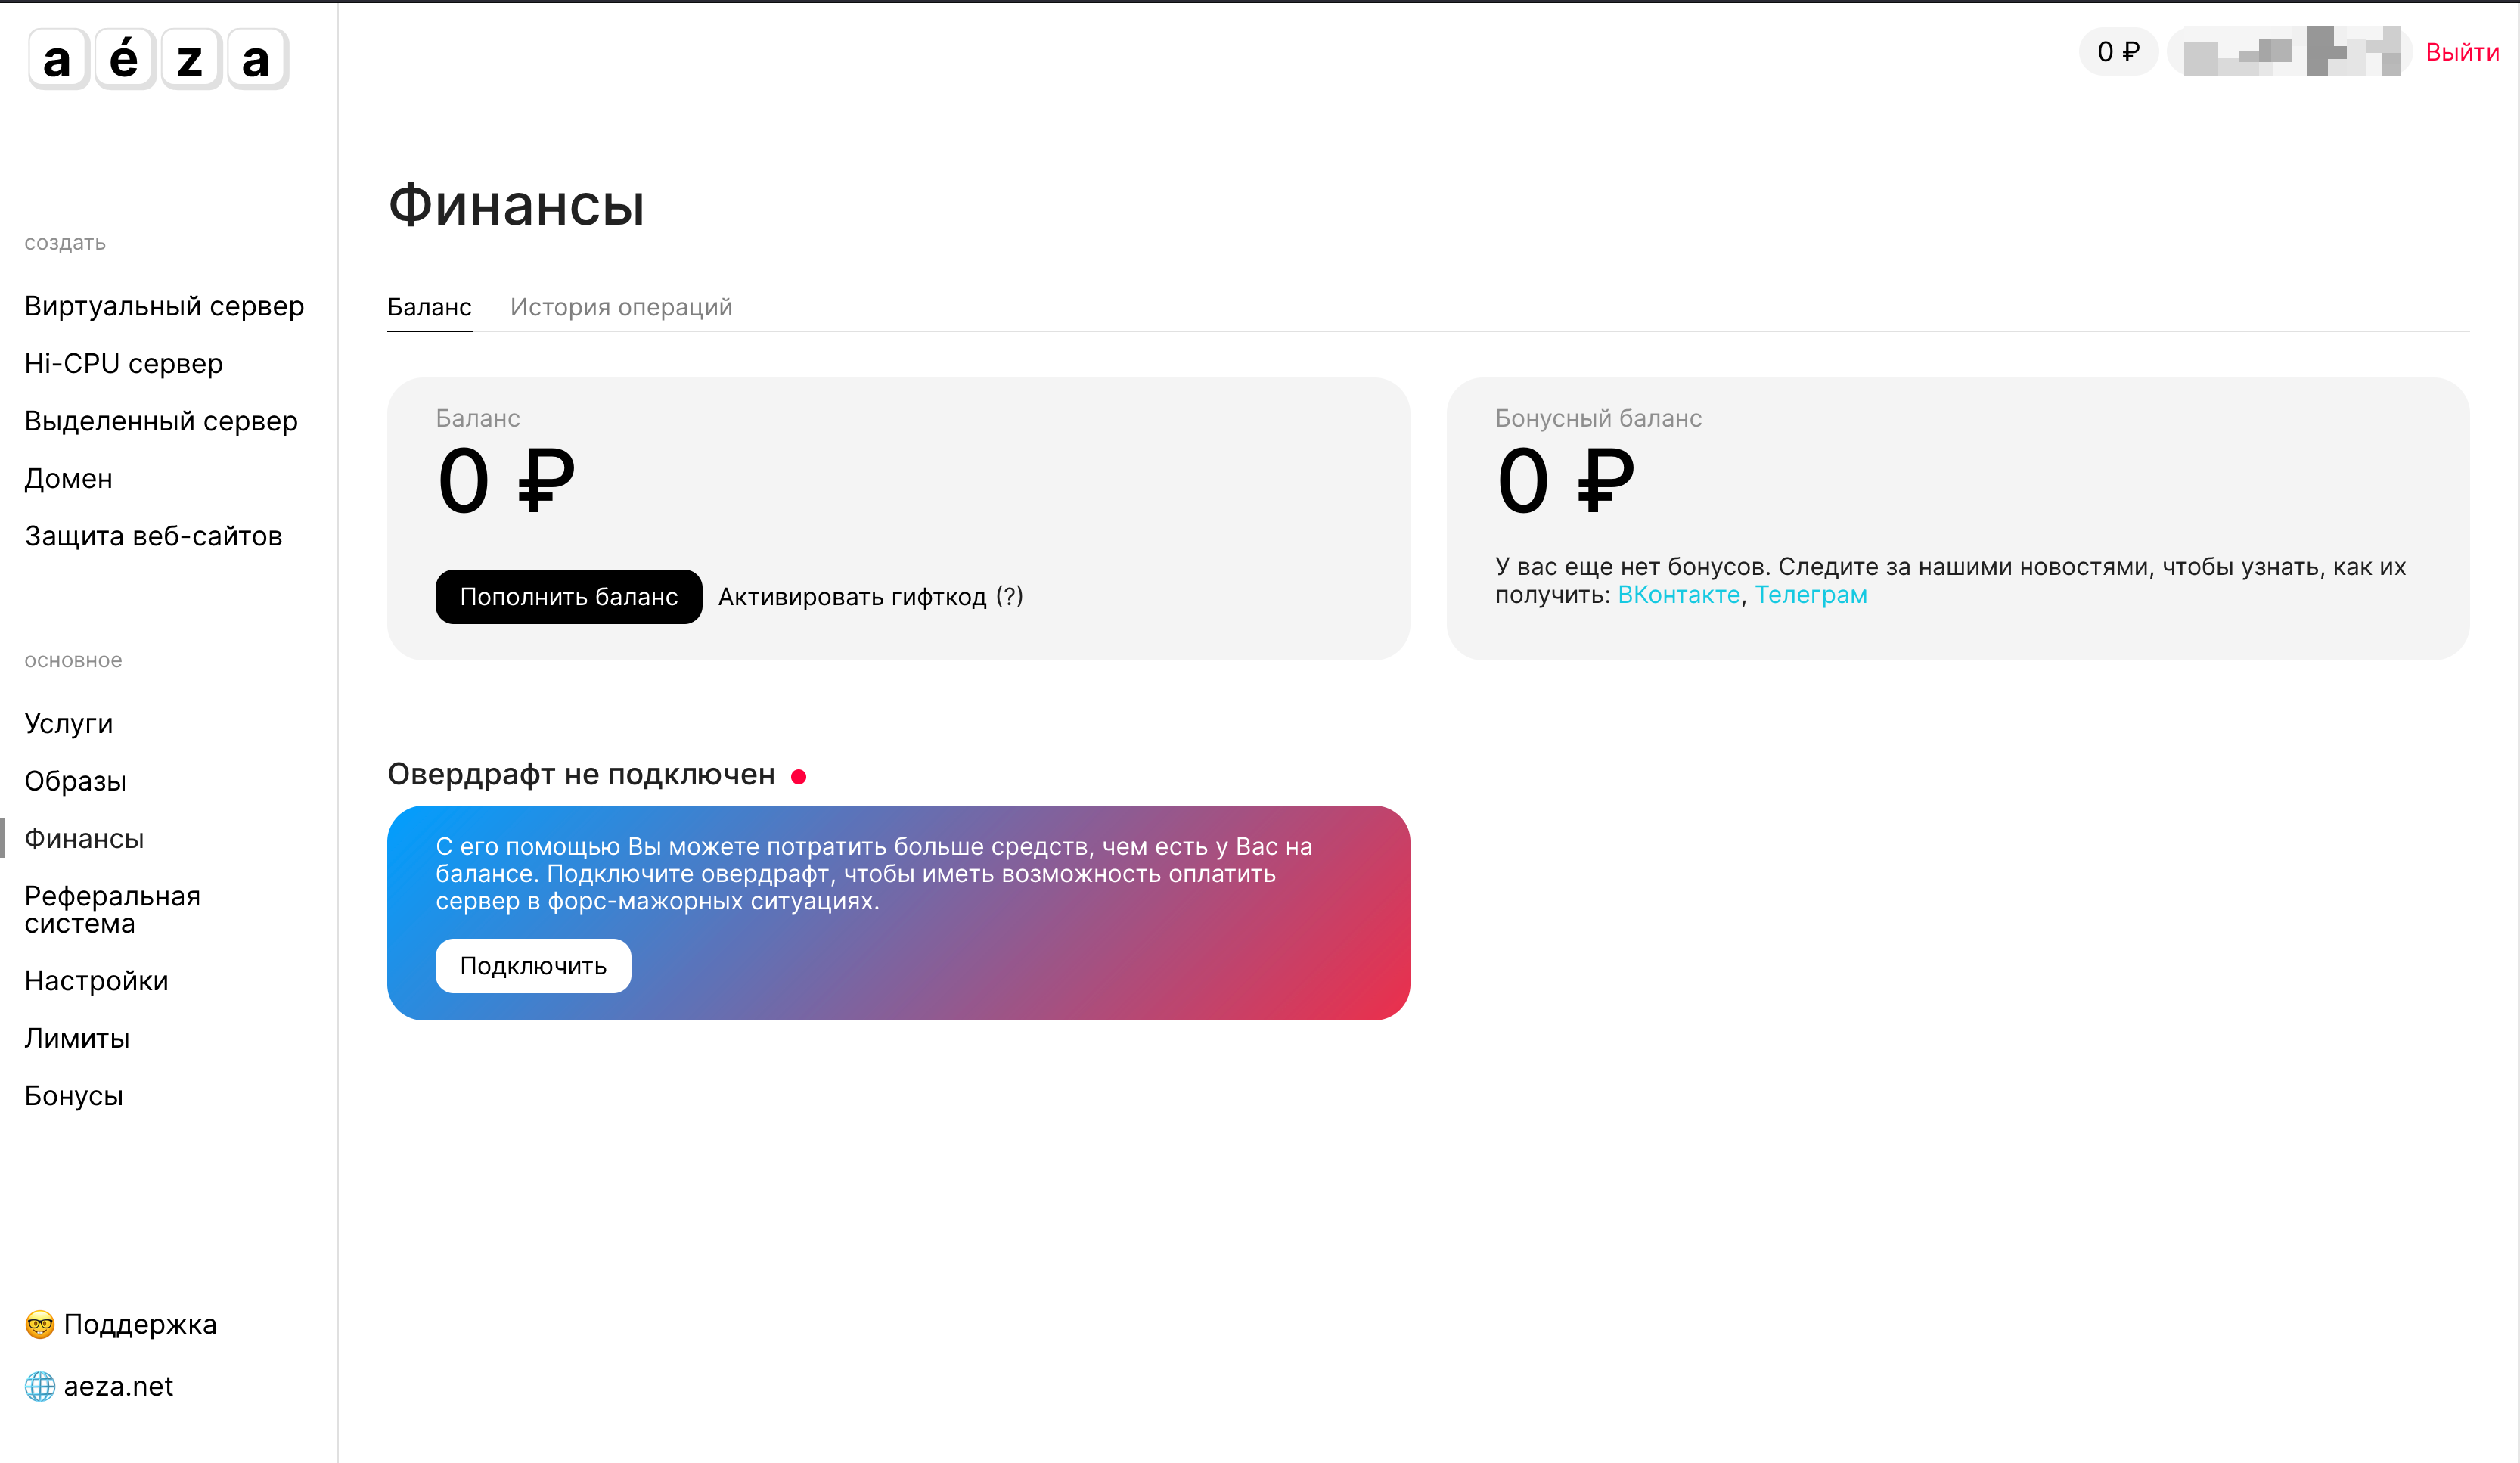
Есть реферальная программа с 15% вознаграждения.
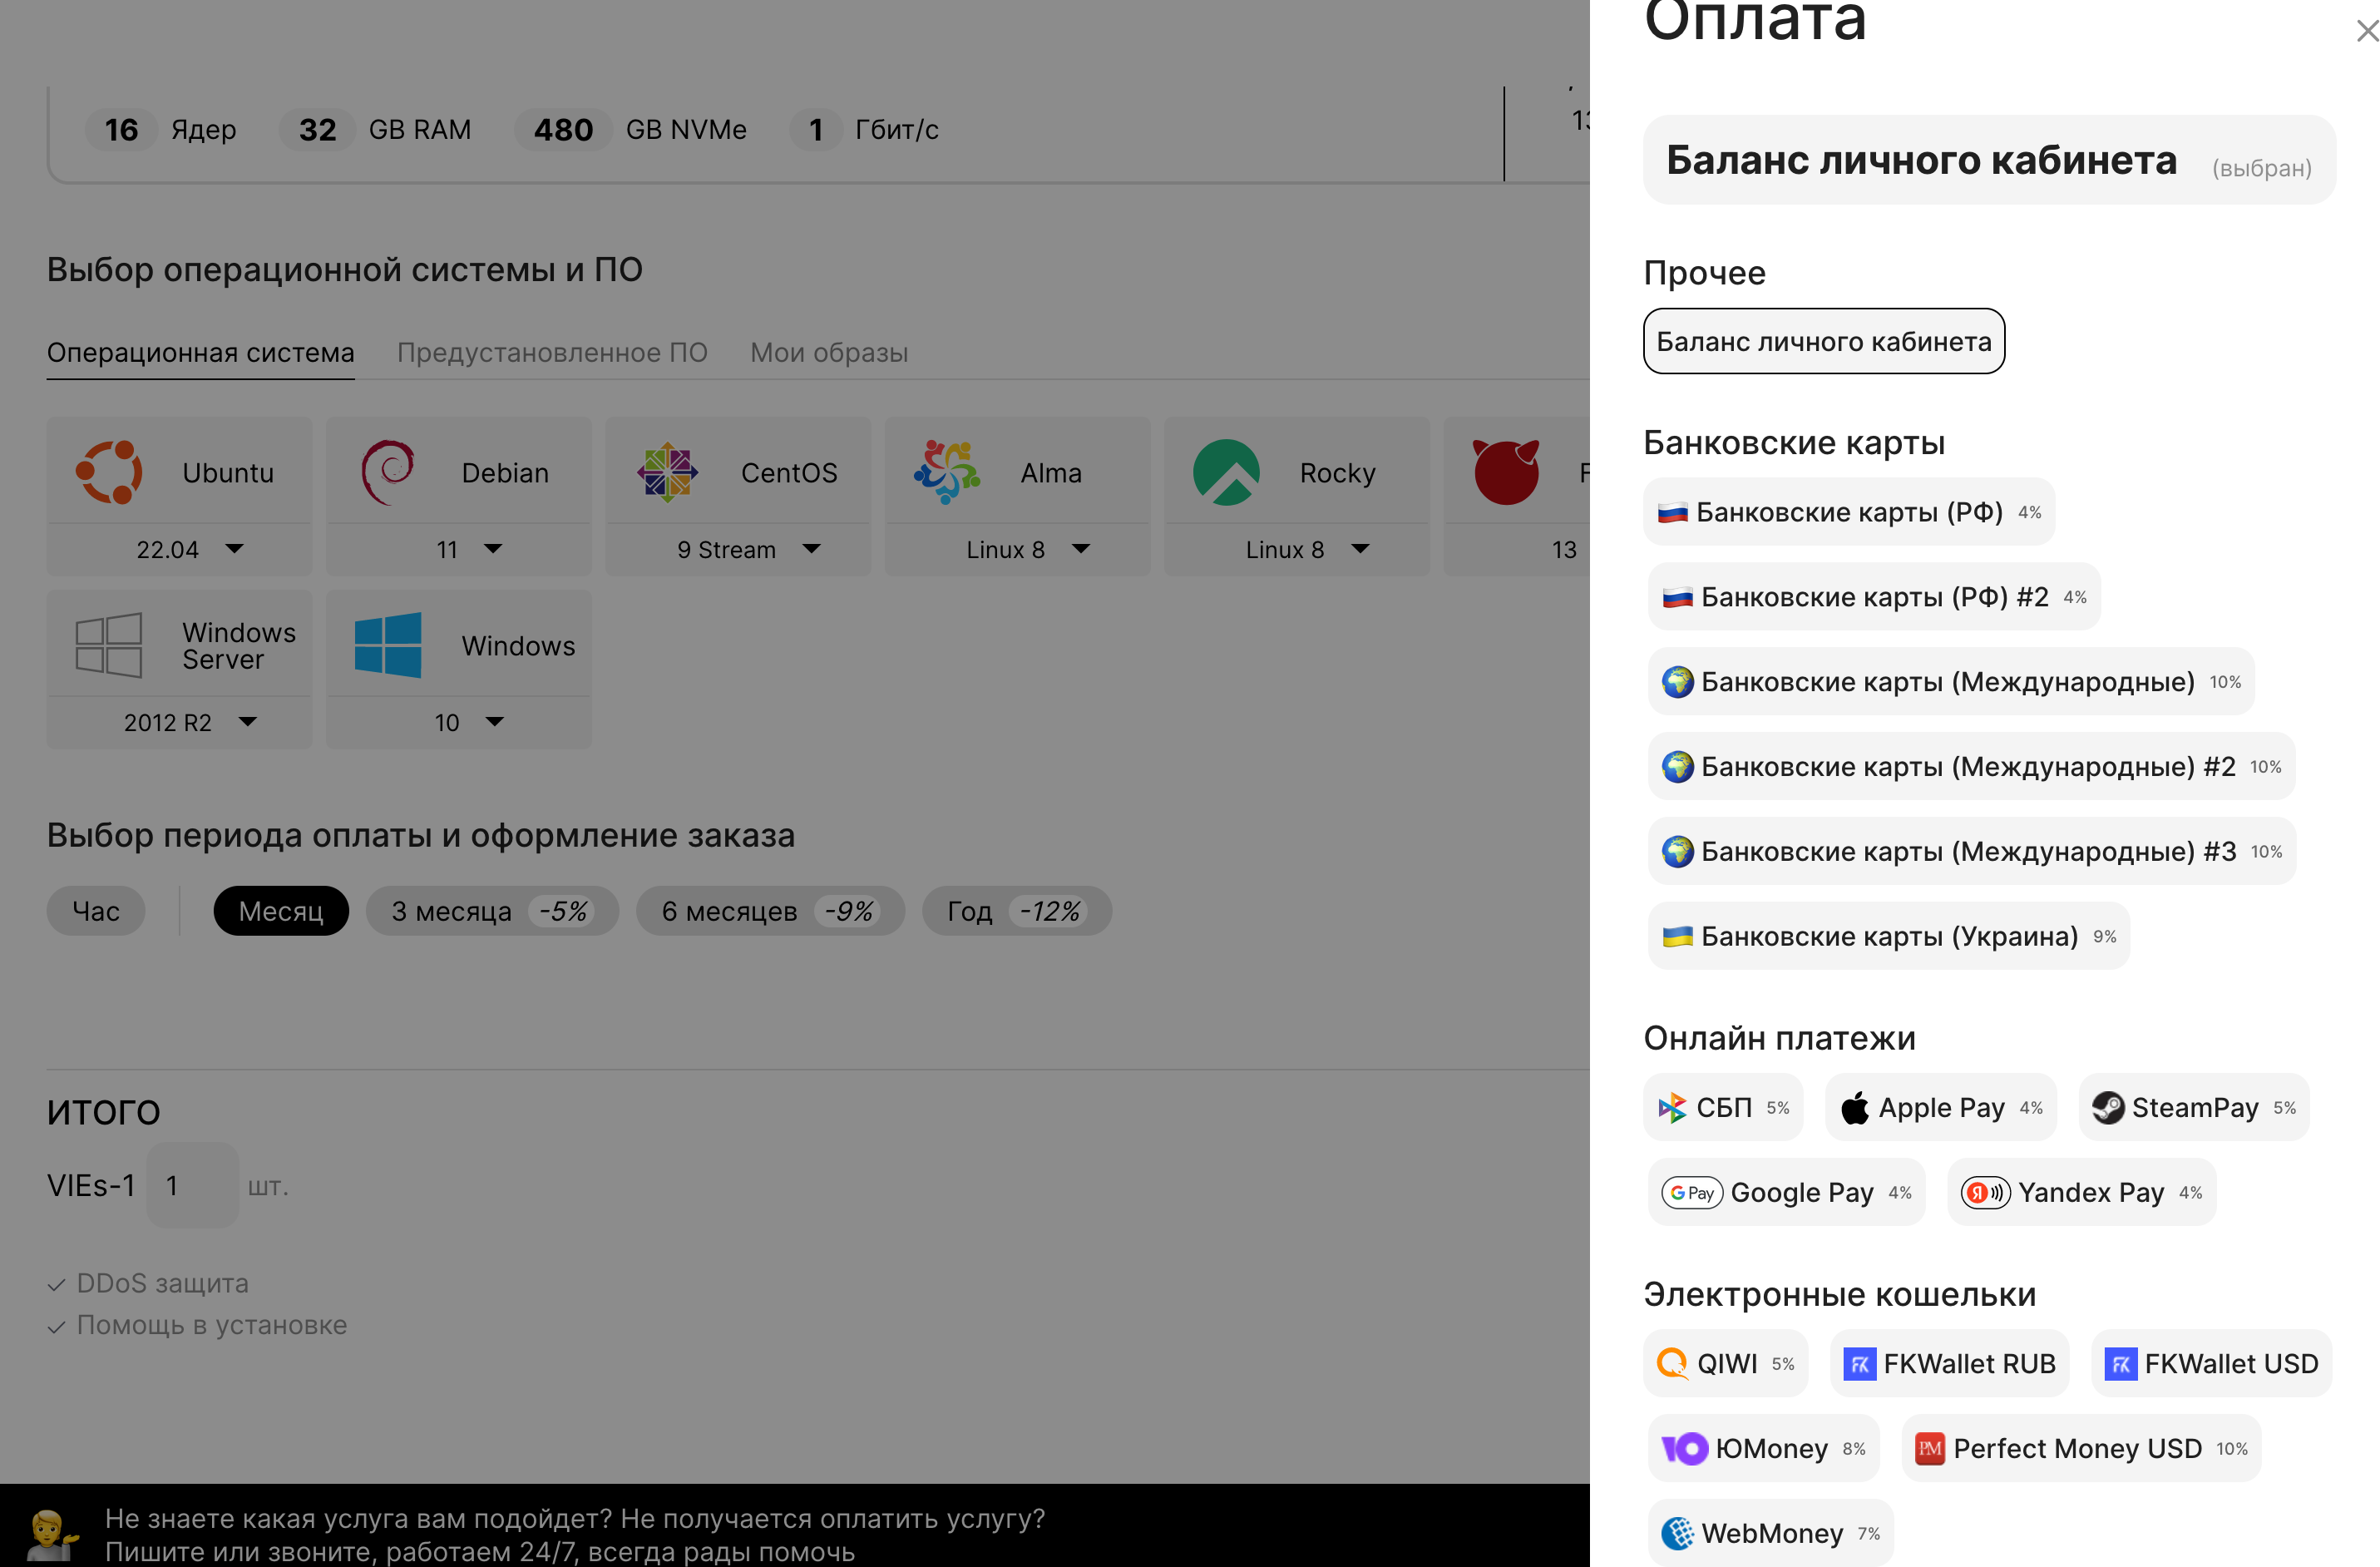
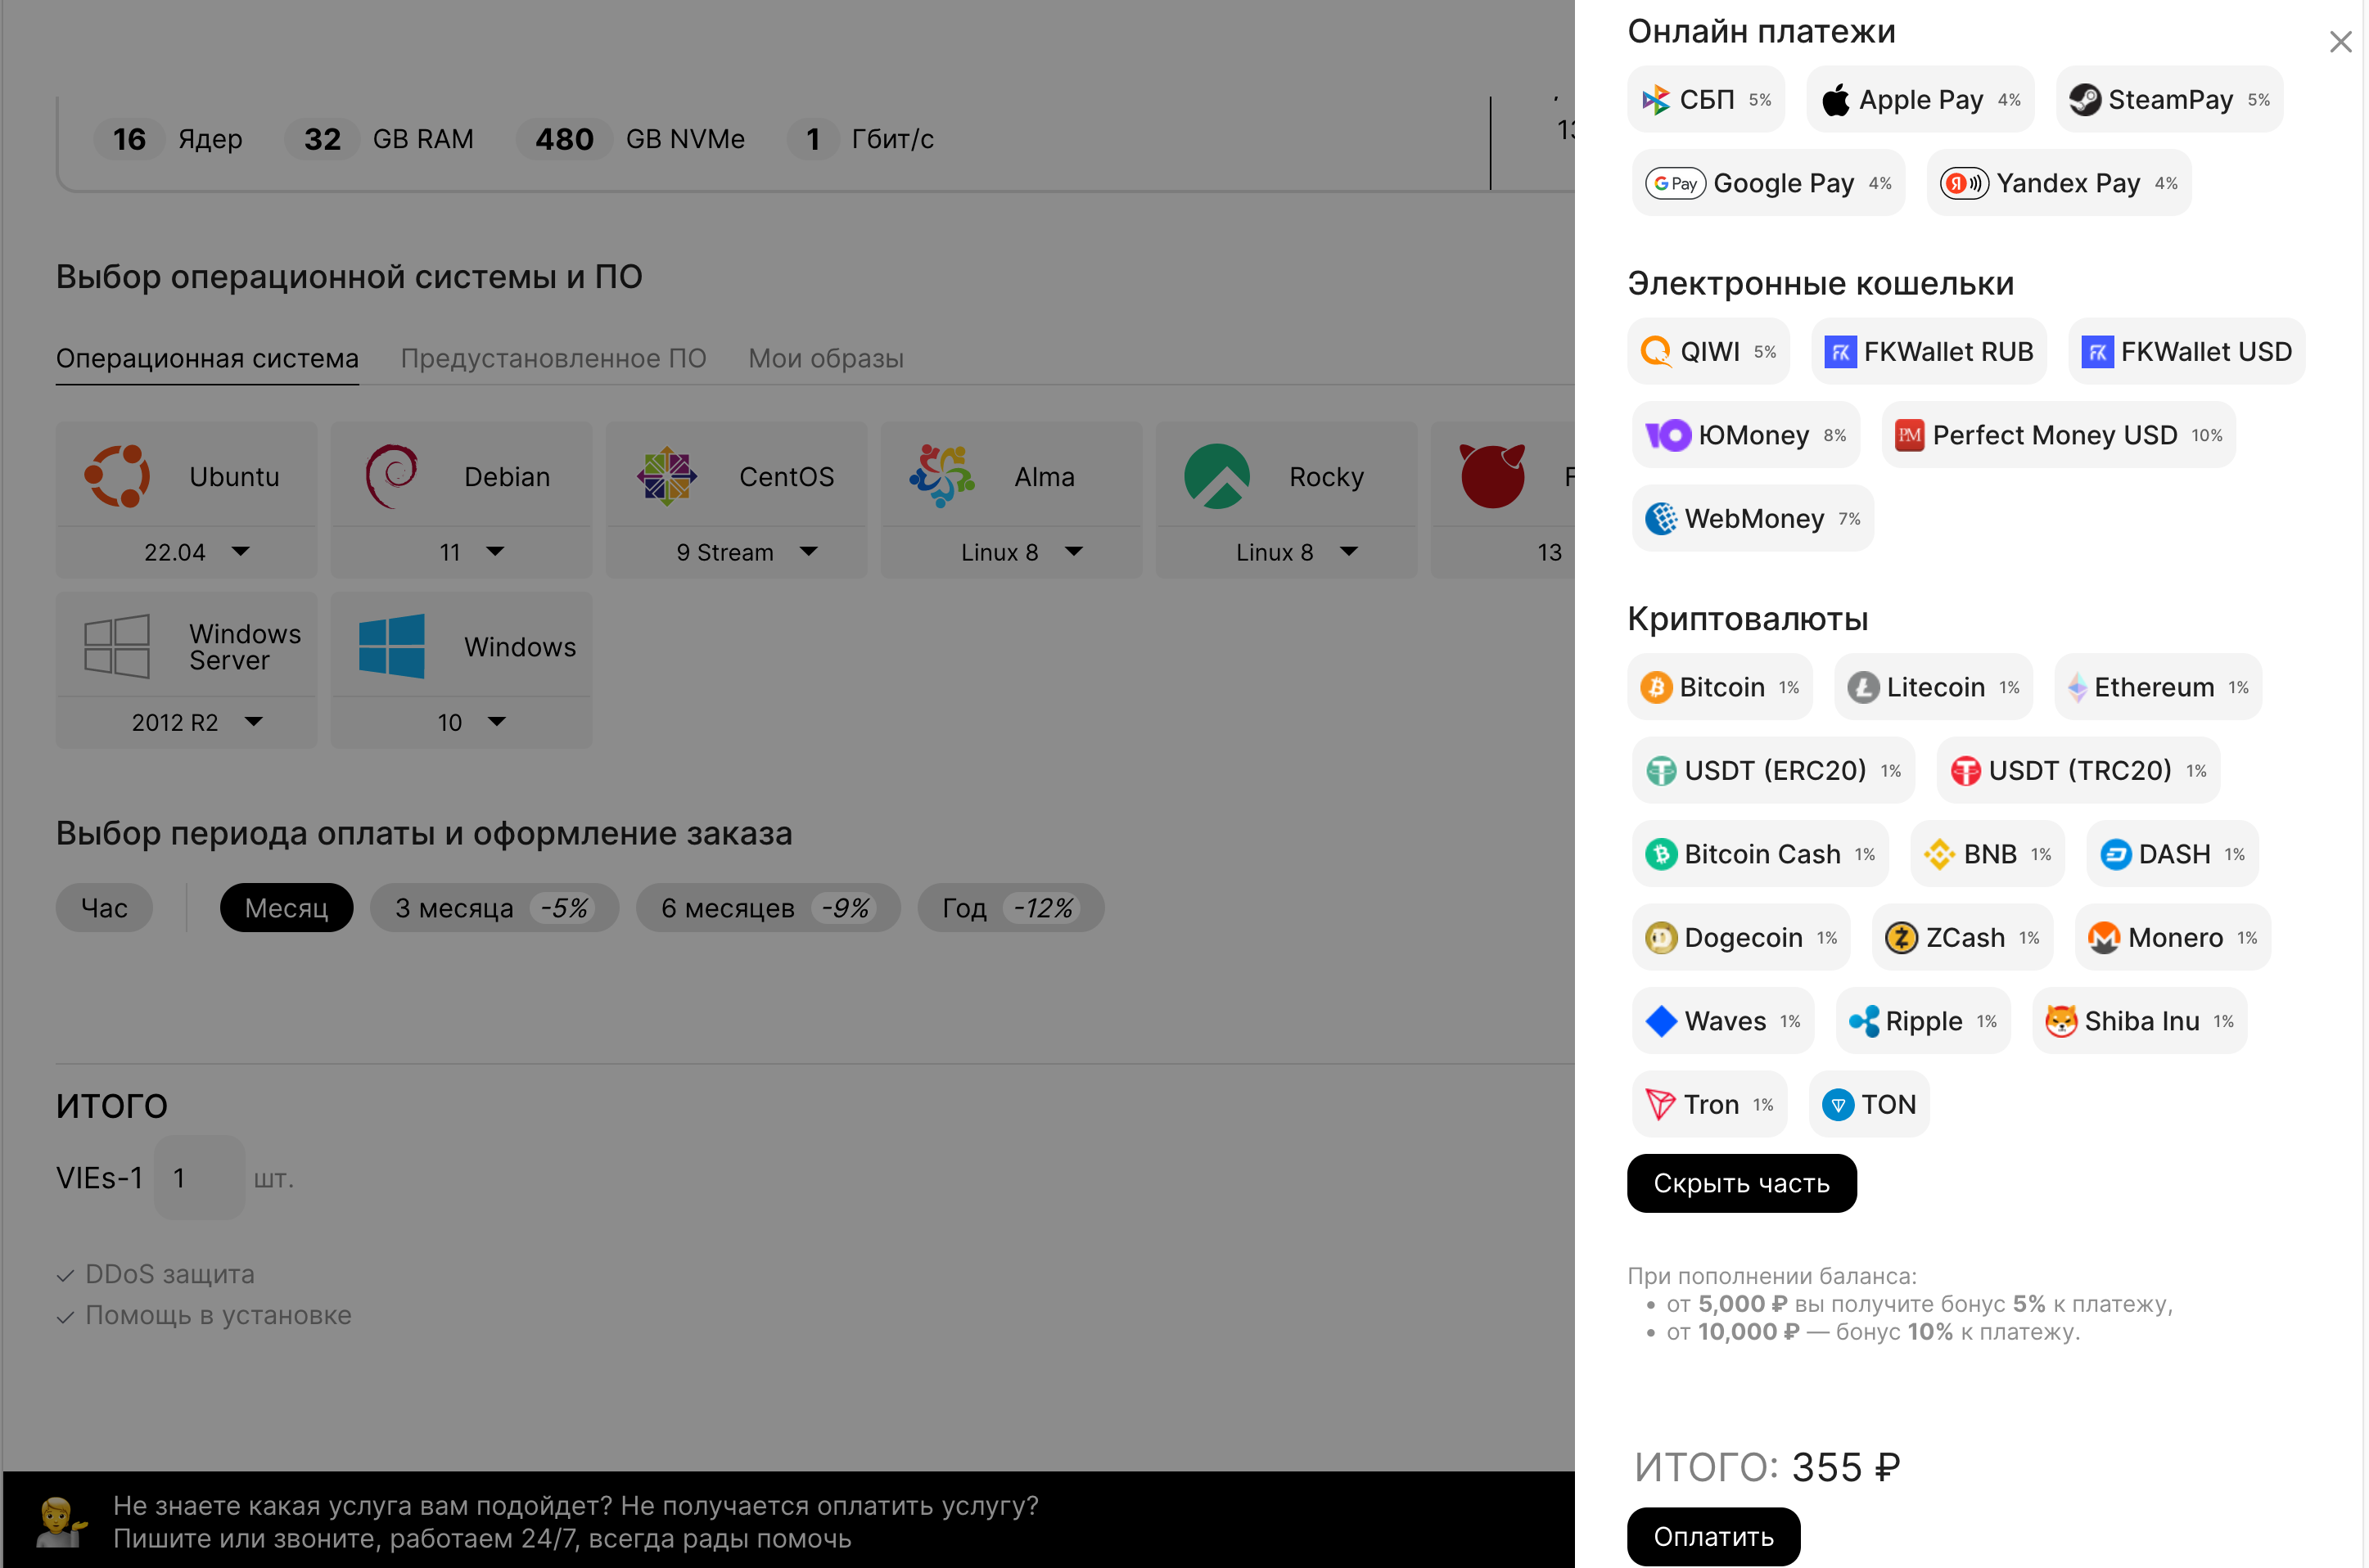
И огромное количество вариантов для оплаты. Платить можно даже напрямую криптой. Если не ошибаюсь все эти способы оплаты предоставляет сервис FreeKassa.
Я пока услуги не оплачивал и поэтому тут пока не могу написать более подробно по комиссиям и прочим моментам.
Итак, перейдем к тестам.
Тест Shared
Сведения о VM
На сервере установлена CentOS 7.9
cat /etc/centos-release
-----------
CentOS Linux release 7.9.2009 (Core)

Kernel info:
====================================================
uname -a
-----------
Linux apatheticorder.aeza.network 3.10.0-1160.71.1.el7.x86_64 #1 SMP Tue Jun 28 15:37:28 UTC 2022 x86_64 x86_64 x86_64 GNU/Linux
Inxi:
inxi -b
-----------
System:
  Host: apatheticorder.aeza.network Kernel: 3.10.0-1160.71.1.el7.x86_64 arch: x86_64 bits: 64
    Console: pty pts/1 Distro: CentOS Linux release 7.9.2009 (Core)
Machine:
  Type: Kvm System: Red Hat product: KVM v: RHEL 7.6.0 PC (i440FX + PIIX, 1996) serial: N/A
  Mobo: N/A model: N/A serial: N/A BIOS: SeaBIOS v: 1.13.0-2.module_el8.5.0+746+bbd5d70c
    date: 04/01/2014
CPU:
  Info: single core AMD EPYC 7551P [UP] speed (MHz): 2000
Graphics:
  Device-1: Cirrus Logic GD 5446 driver: cirrus v: kernel
  Display: server: No display server data found. Headless machine? tty: 160x47
  Message: Unable to show GL data. Required tool glxinfo missing.
Network:
  Device-1: Intel 82371AB/EB/MB PIIX4 ACPI type: network bridge driver: piix4_smbus
  Device-2: Red Hat Virtio network driver: virtio-pci
Drives:
  Local Storage: total: 20 GiB used: 2.85 GiB (14.3%)
Info:
  Processes: 85 Uptime: 6d 41m Memory: 1.79 GiB used: 360.1 MiB (19.6%) Init: systemd
  target: multi-user (3) Shell: Bash inxi: 3.3.19
CPU Info:
cat /proc/cpuinfo
-----------
processor	: 0
vendor_id	: AuthenticAMD
cpu family	: 23
model		: 1
model name	: AMD EPYC 7551P 32-Core Processor
stepping	: 2
microcode	: 0x8001250
cpu MHz		: 1999.999
cache size	: 512 KB
physical id	: 0
siblings	: 1
core id		: 0
cpu cores	: 1
apicid		: 0
initial apicid	: 0
fpu		: yes
fpu_exception	: yes
cpuid level	: 13
wp		: yes
flags		: fpu vme de pse tsc msr pae mce cx8 apic sep mtrr pge mca cmov pat pse36 clflush mmx fxsr sse sse2 syscall nx mmxext fxsr_opt pdpe1gb rdtscp lm art rep_good nopl extd_apicid eagerfpu pni pclmulqdq ssse3 fma cx16 sse4_1 sse4_2 x2apic movbe popcnt tsc_deadline_timer aes xsave avx f16c rdrand hypervisor lahf_lm cmp_legacy svm cr8_legacy abm sse4a misalignsse 3dnowprefetch osvw perfctr_core retpoline_amd ssbd ibpb vmmcall fsgsbase tsc_adjust bmi1 avx2 smep bmi2 rdseed adx smap clflushopt sha_ni xsaveopt xsavec xgetbv1 clzero xsaveerptr virt_ssbd arat npt nrip_save arch_capabilities
bogomips	: 3999.99
TLB size	: 1024 4K pages
clflush size	: 64
cache_alignment	: 64
address sizes	: 48 bits physical, 48 bits virtual
power management:
Memory Info:
cat /proc/meminfo
-----------
MemTotal:        1881964 kB
MemFree:         1352876 kB
MemAvailable:    1537628 kB
Buffers:               0 kB
Cached:           366904 kB
SwapCached:           52 kB
Active:           193728 kB
Inactive:         235088 kB
Active(anon):      62684 kB
Inactive(anon):    62852 kB
Active(file):     131044 kB
Inactive(file):   172236 kB
Unevictable:           0 kB
Mlocked:               0 kB
SwapTotal:       1048572 kB
SwapFree:        1046004 kB
Dirty:                40 kB
Writeback:             0 kB
AnonPages:         61936 kB
Mapped:            12992 kB
Shmem:             63596 kB
Slab:              46640 kB
SReclaimable:      25292 kB
SUnreclaim:        21348 kB
KernelStack:        1632 kB
PageTables:         3908 kB
NFS_Unstable:          0 kB
Bounce:                0 kB
WritebackTmp:          0 kB
CommitLimit:     1989552 kB
Committed_AS:     304888 kB
VmallocTotal:   34359738367 kB
VmallocUsed:       10712 kB
VmallocChunk:   34359724540 kB
Percpu:              176 kB
HardwareCorrupted:     0 kB
AnonHugePages:     10240 kB
CmaTotal:              0 kB
CmaFree:               0 kB
HugePages_Total:       0
HugePages_Free:        0
HugePages_Rsvd:        0
HugePages_Surp:        0
Hugepagesize:       2048 kB
DirectMap4k:       63340 kB
DirectMap2M:     2033664 kB
DirectMap1G:           0 kB
Disk Info:
df -HT
-----------
Filesystem     Type      Size  Used Avail Use% Mounted on
devtmpfs       devtmpfs  953M     0  953M   0% /dev
tmpfs          tmpfs     964M     0  964M   0% /dev/shm
tmpfs          tmpfs     964M   68M  896M   8% /run
tmpfs          tmpfs     964M     0  964M   0% /sys/fs/cgroup
/dev/vda1      xfs        22G  3.1G   19G  15% /
tmpfs          tmpfs     193M     0  193M   0% /run/user/0
PT Summary:
pt-summary
-----------
# Percona Toolkit System Summary Report ######################
        Date | 2022-08-04 10:28:50 UTC (local TZ: MSK +0300)
    Hostname | apatheticorder.aeza.network
      Uptime | 6 days, 41 min,  1 user,  load average: 0.15, 0.10, 0.07
      System | Red Hat; KVM; vRHEL 7.6.0 PC (i440FX + PIIX, 1996) (Other)
 Service Tag | Not Specified
    Platform | Linux
     Release | CentOS Linux release 7.9.2009 (Core)
      Kernel | 3.10.0-1160.71.1.el7.x86_64
Architecture | CPU = 64-bit, OS = 64-bit
   Threading | NPTL 2.17
     SELinux | Disabled
 Virtualized | VMWare
# Processor ##################################################
  Processors | physical = 1, cores = 1, virtual = 1, hyperthreading = no
      Speeds | 1x1999.999
      Models | 1xAMD EPYC 7551P 32-Core Processor
      Caches | 1x512 KB
# Memory #####################################################
       Total | 1.8G
        Free | 1.3G
        Used | physical = 136.4M, swap allocated = 1024.0M, swap used = 2.5M, virtual = 138.9M
      Shared | 62.1M
     Buffers | 0.0
      Caches | 384.2M
       Dirty | 104 kB
     UsedRSS | 118.2M
  Swappiness | 30
 DirtyPolicy | 30, 10
 DirtyStatus | 0, 0
  Locator   Size     Speed             Form Factor   Type          Type Detail
  ========= ======== ================= ============= ============= ===========
  DIMM 0    2048 MB  Unknown           DIMM          RAM           Other
# Mounted Filesystems ########################################
  Filesystem  Size Used Type     Opts                                             Mountpoint
  devtmpfs    909M   0% devtmpfs rw,nosuid,size=930420k,nr_inodes=232605,mode=755 /dev
  /dev/vda1    20G  15% xfs      rw,relatime,attr2,inode64,noquota                /
  tmpfs       184M   0% tmpfs    rw,nosuid,nodev                                  /run/user/0
  tmpfs       184M   0% tmpfs    rw,nosuid,nodev,mode=755                         /run/user/0
  tmpfs       184M   0% tmpfs    rw,nosuid,nodev,relatime,size=188200k,mode=700   /run/user/0
  tmpfs       184M   0% tmpfs    ro,nosuid,nodev,noexec,mode=755                  /run/user/0
  tmpfs       919M   0% tmpfs    rw,nosuid,nodev                                  /dev/shm
  tmpfs       919M   0% tmpfs    rw,nosuid,nodev,mode=755                         /dev/shm
  tmpfs       919M   0% tmpfs    rw,nosuid,nodev,relatime,size=188200k,mode=700   /dev/shm
  tmpfs       919M   0% tmpfs    ro,nosuid,nodev,noexec,mode=755                  /dev/shm
  tmpfs       919M   0% tmpfs    rw,nosuid,nodev                                  /sys/fs/cgroup
  tmpfs       919M   0% tmpfs    rw,nosuid,nodev,mode=755                         /sys/fs/cgroup
  tmpfs       919M   0% tmpfs    rw,nosuid,nodev,relatime,size=188200k,mode=700   /sys/fs/cgroup
  tmpfs       919M   0% tmpfs    ro,nosuid,nodev,noexec,mode=755                  /sys/fs/cgroup
  tmpfs       919M   8% tmpfs    rw,nosuid,nodev                                  /run
  tmpfs       919M   8% tmpfs    rw,nosuid,nodev,mode=755                         /run
  tmpfs       919M   8% tmpfs    rw,nosuid,nodev,relatime,size=188200k,mode=700   /run
  tmpfs       919M   8% tmpfs    ro,nosuid,nodev,noexec,mode=755                  /run
# Disk Schedulers And Queue Size #############################
         vda | [mq-deadline] 256
# Disk Partioning ############################################
Device       Type      Start        End               Size
============ ==== ========== ========== ==================
/dev/vda     Disk                              21474836480
/dev/vda1    Part       2048   41940735        21472607744
# Kernel Inode State #########################################
dentry-state | 23758	13286	45	0	3837	0
     file-nr | 1120	0	182675
    inode-nr | 21425	1751
# LVM Volumes ################################################
Unable to collect information
# LVM Volume Groups ##########################################
Unable to collect information
# RAID Controller ############################################
  Controller | No RAID controller detected
# Network Config #############################################
  Controller | Red Hat, Inc. Virtio network device
 FIN Timeout | 60
  Port Range | 60999
# Interface Statistics #######################################
  interface  rx_bytes rx_packets  rx_errors   tx_bytes tx_packets  tx_errors
  ========= ========= ========== ========== ========== ========== ==========
  lo             6000         60          0       6000         60          0
  eth0      600000000     600000          0  225000000     500000          0
# Network Devices ############################################
  Device    Speed     Duplex
  ========= ========= =========
  eth0
# Top Processes ##############################################
  PID USER      PR  NI    VIRT    RES    SHR S %CPU %MEM     TIME+ COMMAND
    1 root      20   0  125512   3220   1888 S  0.0  0.2   0:11.28 systemd
    2 root      20   0       0      0      0 S  0.0  0.0   0:00.09 kthreadd
    4 root       0 -20       0      0      0 S  0.0  0.0   0:00.00 kworker/0:0H
    5 root      20   0       0      0      0 S  0.0  0.0   0:00.90 kworker/u2:0
    6 root      20   0       0      0      0 S  0.0  0.0   0:03.21 ksoftirqd/0
    7 root      rt   0       0      0      0 S  0.0  0.0   0:00.00 migration/0
    8 root      20   0       0      0      0 S  0.0  0.0   0:00.00 rcu_bh
    9 root      20   0       0      0      0 R  0.0  0.0   0:16.02 rcu_sched
   10 root       0 -20       0      0      0 S  0.0  0.0   0:00.00 lru-add-dra+
# Notable Processes ##########################################
  PID    OOM    COMMAND
  845    -17    sshd
# Memory management ##########################################
Transparent huge pages are enabled.
# The End ####################################################
Тесты
DD:
dd if=/dev/zero of=test bs=64k count=16k conv=fdatasync 2>&1
rm -f test
-----------
16384+0 records in
16384+0 records out
1073741824 bytes (1.1 GB) copied, 3.59594 s, 299 MB/s
16384+0 records in
16384+0 records out
1073741824 bytes (1.1 GB) copied, 1.17923 s, 911 MB/s
16384+0 records in
16384+0 records out
1073741824 bytes (1.1 GB) copied, 16.2597 s, 66.0 MB/s
Скорость диска при линейном копировании показывает нестабильные результаты, но усредненное значение на достойном уровне.
Sysbench CPU:
Sysbench CPU:
====================================================
sysbench cpu --cpu-max-prime=20000 --num-threads=1 run
-----------
sysbench 1.0.20 (using bundled LuaJIT 2.1.0-beta2)

Running the test with following options:
Number of threads: 1
Initializing random number generator from current time


Prime numbers limit: 20000

Initializing worker threads...

Threads started!

CPU speed:
    events per second:   398.53

General statistics:
    total time:                          10.0014s
    total number of events:              3987

Latency (ms):
         min:                                    2.11
         avg:                                    2.50
         max:                                   17.27
         95th percentile:                        3.25
         sum:                                 9976.86

Threads fairness:
    events (avg/stddev):           3987.0000/0.00
    execution time (avg/stddev):   9.9769/0.00


Sysbench CPU Mutex 64:
====================================================
sysbench mutex --threads=64 run
-----------
sysbench 1.0.20 (using bundled LuaJIT 2.1.0-beta2)

Running the test with following options:
Number of threads: 64
Initializing random number generator from current time


Initializing worker threads...

Threads started!


General statistics:
    total time:                          19.3519s
    total number of events:              64

Latency (ms):
         min:                                17507.64
         avg:                                18670.14
         max:                                19260.27
         95th percentile:                    19078.64
         sum:                              1194888.88

Threads fairness:
    events (avg/stddev):           1.0000/0.00
    execution time (avg/stddev):   18.6701/0.36


Memory size for Sysbench Memory test: 1G
Disk space for Sysbench Disk test: 2G
По CPU тут все в норме.
Sysbench Memory test:
А вот тест ОЗУ показал неважные результаты.
sysbench memory --num-threads=4 --memory-total-size=1G run
-----------
WARNING: --num-threads is deprecated, use --threads instead
sysbench 1.0.20 (using bundled LuaJIT 2.1.0-beta2)

Running the test with following options:
Number of threads: 4
Initializing random number generator from current time


Running memory speed test with the following options:
  block size: 1KiB
  total size: 1024MiB
  operation: write
  scope: global

Initializing worker threads...

Threads started!

Total operations: 1048576 (771304.40 per second)

1024.00 MiB transferred (753.23 MiB/sec)


General statistics:
    total time:                          1.3577s
    total number of events:              1048576

Latency (ms):
         min:                                    0.00
         avg:                                    0.00
         max:                                   44.79
         95th percentile:                        0.00
         sum:                                 1976.61

Threads fairness:
    events (avg/stddev):           262144.0000/0.00
    execution time (avg/stddev):   0.4942/0.11
Sysbench Disk test:
Подготавливаем тестовые файлы.
sysbench fileio --file-total-size=2G prepare
-----------
sysbench 1.0.20 (using bundled LuaJIT 2.1.0-beta2)

128 files, 16384Kb each, 2048Mb total
Creating files for the test...
Extra file open flags: (none)
Creating file test_file.0
...
Creating file test_file.127
2147483648 bytes written in 10.40 seconds (196.88 MiB/sec).
Запускаем тест.
sysbench fileio --file-total-size=2G --file-test-mode=rndrw --time=300 --max-requests=0 run
-----------
sysbench 1.0.20 (using bundled LuaJIT 2.1.0-beta2)

Running the test with following options:
Number of threads: 1
Initializing random number generator from current time


Extra file open flags: (none)
128 files, 16MiB each
2GiB total file size
Block size 16KiB
Number of IO requests: 0
Read/Write ratio for combined random IO test: 1.50
Periodic FSYNC enabled, calling fsync() each 100 requests.
Calling fsync() at the end of test, Enabled.
Using synchronous I/O mode
Doing random r/w test
Initializing worker threads...

Threads started!


File operations:
    reads/s:                      741.12
    writes/s:                     494.08
    fsyncs/s:                     1581.22

Throughput:
    read, MiB/s:                  11.58
    written, MiB/s:               7.72

General statistics:
    total time:                          300.0757s
    total number of events:              845029

Latency (ms):
         min:                                    0.00
         avg:                                    0.35
         max:                                  482.04
         95th percentile:                        1.04
         sum:                               297990.10

Threads fairness:
    events (avg/stddev):           845029.0000/0.00
    execution time (avg/stddev):   297.9901/0.00
Результаты этого теста очень достойные. Получилось в 2.5 раза быстрее чем в тесте VDSina 2020 года. Но в 3 раза медленнее чем Hetzner
Speedtest cli:
Скорость сети довольно высокая.
speedtest-cli
-----------
Retrieving speedtest.net configuration...
Testing from AEZA GROUP Ltd (45.142.122.xx)...
Retrieving speedtest.net server list...
Selecting best server based on ping...
Hosted by Miranda-media Yevpatoria (Yevpatoria) [2215.93 km]: 26.066 ms
Testing download speed................................................................................
Download: 763.75 Mbit/s
Testing upload speed......................................................................................................
Upload: 336.88 Mbit/s
7-zip benchmark:
7za b
-----------

7-Zip (a) [64] 16.02 : Copyright (c) 1999-2016 Igor Pavlov : 2016-05-21
p7zip Version 16.02 (locale=en_US.UTF-8,Utf16=on,HugeFiles=on,64 bits,1 CPU AMD EPYC 7551P 32-Core Processor                (800F12),ASM,AES-NI)

AMD EPYC 7551P 32-Core Processor                (800F12)
CPU Freq:  2180  2255  2066  2374  2320  2293  2225  2242  2143

RAM size:    1837 MB,  # CPU hardware threads:   1
RAM usage:    435 MB,  # Benchmark threads:      1

                       Compressing  |                  Decompressing
Dict     Speed Usage    R/U Rating  |      Speed Usage    R/U Rating
         KiB/s     %   MIPS   MIPS  |      KiB/s     %   MIPS   MIPS

22:       1723    99   1700   1676  |      25201    98   2191   2152
23:       1579    99   1630   1609  |      24595    98   2178   2129
24:       1508    98   1653   1622  |      23871    98   2142   2096
25:       1370    98   1592   1565  |      23342    98   2110   2078
----------------------------------  | ------------------------------
Avr:              98   1644   1618  |               98   2155   2113
Tot:              98   1900   1866
Результаты бенчмарка 7-zip не выдающиеся.
Тест Dedicated
Сведения о VM
На сервере установлена CentOS 7.9
cat /etc/centos-release
-----------
CentOS Linux release 7.9.2009 (Core)

Kernel info:
====================================================
uname -a
-----------
Linux puzzlingorange.aeza.network 3.10.0-1160.71.1.el7.x86_64 #1 SMP Tue Jun 28 15:37:28 UTC 2022 x86_64 x86_64 x86_64 GNU/Linux
Inxi:
inxi -b
-----------
System:
  Host: puzzlingorange.aeza.network Kernel: 3.10.0-1160.71.1.el7.x86_64 arch: x86_64 bits: 64
    Console: pty pts/1 Distro: CentOS Linux release 7.9.2009 (Core)
Machine:
  Type: Kvm System: Red Hat product: KVM v: RHEL 7.6.0 PC (i440FX + PIIX, 1996) serial: N/A
  Mobo: N/A model: N/A serial: N/A BIOS: SeaBIOS v: 1.13.0-2.module_el8.5.0+746+bbd5d70c
    date: 04/01/2014
CPU:
  Info: single core AMD EPYC 7551P [UP] speed (MHz): 2000
Graphics:
  Device-1: Cirrus Logic GD 5446 driver: cirrus v: kernel
  Display: server: No display server data found. Headless machine? tty: 160x47
  Message: Unable to show GL data. Required tool glxinfo missing.
Network:
  Device-1: Intel 82371AB/EB/MB PIIX4 ACPI type: network bridge driver: piix4_smbus
  Device-2: Red Hat Virtio network driver: virtio-pci
Drives:
  Local Storage: total: 20 GiB used: 2.87 GiB (14.4%)
Info:
  Processes: 83 Uptime: 6d 41m Memory: 1.79 GiB used: 389.2 MiB (21.2%) Init: systemd
  target: multi-user (3) Shell: Bash inxi: 3.3.19
CPU Info:
cat /proc/cpuinfo
-----------
processor	: 0
vendor_id	: AuthenticAMD
cpu family	: 23
model		: 1
model name	: AMD EPYC 7551P 32-Core Processor
stepping	: 2
microcode	: 0x8001250
cpu MHz		: 1999.870
cache size	: 512 KB
physical id	: 0
siblings	: 1
core id		: 0
cpu cores	: 1
apicid		: 0
initial apicid	: 0
fpu		: yes
fpu_exception	: yes
cpuid level	: 13
wp		: yes
flags		: fpu vme de pse tsc msr pae mce cx8 apic sep mtrr pge mca cmov pat pse36 clflush mmx fxsr sse sse2 syscall nx mmxext fxsr_opt pdpe1gb rdtscp lm art rep_good nopl extd_apicid eagerfpu pni pclmulqdq ssse3 fma cx16 sse4_1 sse4_2 x2apic movbe popcnt tsc_deadline_timer aes xsave avx f16c rdrand hypervisor lahf_lm cmp_legacy svm cr8_legacy abm sse4a misalignsse 3dnowprefetch osvw perfctr_core retpoline_amd ssbd ibpb vmmcall fsgsbase tsc_adjust bmi1 avx2 smep bmi2 rdseed adx smap clflushopt sha_ni xsaveopt xsavec xgetbv1 clzero xsaveerptr virt_ssbd arat npt nrip_save arch_capabilities
bogomips	: 3999.74
TLB size	: 1024 4K pages
clflush size	: 64
cache_alignment	: 64
address sizes	: 48 bits physical, 48 bits virtual
power management:
Memory Info:
cat /proc/meminfo
-----------
MemTotal:        1881964 kB
MemFree:         1327732 kB
MemAvailable:    1507880 kB
Buffers:               0 kB
Cached:           395696 kB
SwapCached:           12 kB
Active:           189416 kB
Inactive:         265648 kB
Active(anon):      78036 kB
Inactive(anon):    78156 kB
Active(file):     111380 kB
Inactive(file):   187492 kB
Unevictable:           0 kB
Mlocked:               0 kB
SwapTotal:       1048572 kB
SwapFree:        1038332 kB
Dirty:                 4 kB
Writeback:             0 kB
AnonPages:         59376 kB
Mapped:            14140 kB
Shmem:             96836 kB
Slab:              45368 kB
SReclaimable:      24904 kB
SUnreclaim:        20464 kB
KernelStack:        1616 kB
PageTables:         4004 kB
NFS_Unstable:          0 kB
Bounce:                0 kB
WritebackTmp:          0 kB
CommitLimit:     1989552 kB
Committed_AS:     345876 kB
VmallocTotal:   34359738367 kB
VmallocUsed:       10712 kB
VmallocChunk:   34359724540 kB
Percpu:              176 kB
HardwareCorrupted:     0 kB
AnonHugePages:      6144 kB
CmaTotal:              0 kB
CmaFree:               0 kB
HugePages_Total:       0
HugePages_Free:        0
HugePages_Rsvd:        0
HugePages_Surp:        0
Hugepagesize:       2048 kB
DirectMap4k:       61292 kB
DirectMap2M:     2035712 kB
DirectMap1G:           0 kB
Disk Info:
df -HT
-----------
Filesystem     Type      Size  Used Avail Use% Mounted on
devtmpfs       devtmpfs  953M     0  953M   0% /dev
tmpfs          tmpfs     964M     0  964M   0% /dev/shm
tmpfs          tmpfs     964M  110M  855M  12% /run
tmpfs          tmpfs     964M     0  964M   0% /sys/fs/cgroup
/dev/vda1      xfs        22G  3.1G   19G  15% /
tmpfs          tmpfs     193M     0  193M   0% /run/user/0
Percona Tools summary:
pt-summary
-----------
# Percona Toolkit System Summary Report ######################
        Date | 2022-08-04 10:31:12 UTC (local TZ: MSK +0300)
    Hostname | puzzlingorange.aeza.network
      Uptime | 6 days, 41 min,  1 user,  load average: 0.10, 0.06, 0.06
      System | Red Hat; KVM; vRHEL 7.6.0 PC (i440FX + PIIX, 1996) (Other)
 Service Tag | Not Specified
    Platform | Linux
     Release | CentOS Linux release 7.9.2009 (Core)
      Kernel | 3.10.0-1160.71.1.el7.x86_64
Architecture | CPU = 64-bit, OS = 64-bit
   Threading | NPTL 2.17
     SELinux | Disabled
 Virtualized | VMWare
# Processor ##################################################
  Processors | physical = 1, cores = 1, virtual = 1, hyperthreading = no
      Speeds | 1x1999.870
      Models | 1xAMD EPYC 7551P 32-Core Processor
      Caches | 1x512 KB
# Memory #####################################################
       Total | 1.8G
        Free | 1.3G
        Used | physical = 131.3M, swap allocated = 1024.0M, swap used = 10.0M, virtual = 141.3M
      Shared | 94.6M
     Buffers | 0.0
      Caches | 412.0M
       Dirty | 72 kB
     UsedRSS | 92.0M
  Swappiness | 30
 DirtyPolicy | 30, 10
 DirtyStatus | 0, 0
  Locator   Size     Speed             Form Factor   Type          Type Detail
  ========= ======== ================= ============= ============= ===========
  DIMM 0    2048 MB  Unknown           DIMM          RAM           Other
# Mounted Filesystems ########################################
  Filesystem  Size Used Type     Opts                                             Mountpoint
  devtmpfs    909M   0% devtmpfs rw,nosuid,size=930420k,nr_inodes=232605,mode=755 /dev
  /dev/vda1    20G  15% xfs      rw,relatime,attr2,inode64,noquota                /
  tmpfs       184M   0% tmpfs    rw,nosuid,nodev                                  /run/user/0
  tmpfs       184M   0% tmpfs    rw,nosuid,nodev,mode=755                         /run/user/0
  tmpfs       184M   0% tmpfs    rw,nosuid,nodev,relatime,size=188200k,mode=700   /run/user/0
  tmpfs       184M   0% tmpfs    ro,nosuid,nodev,noexec,mode=755                  /run/user/0
  tmpfs       919M   0% tmpfs    rw,nosuid,nodev                                  /dev/shm
  tmpfs       919M   0% tmpfs    rw,nosuid,nodev,mode=755                         /dev/shm
  tmpfs       919M   0% tmpfs    rw,nosuid,nodev,relatime,size=188200k,mode=700   /dev/shm
  tmpfs       919M   0% tmpfs    ro,nosuid,nodev,noexec,mode=755                  /dev/shm
  tmpfs       919M   0% tmpfs    rw,nosuid,nodev                                  /sys/fs/cgroup
  tmpfs       919M   0% tmpfs    rw,nosuid,nodev,mode=755                         /sys/fs/cgroup
  tmpfs       919M   0% tmpfs    rw,nosuid,nodev,relatime,size=188200k,mode=700   /sys/fs/cgroup
  tmpfs       919M   0% tmpfs    ro,nosuid,nodev,noexec,mode=755                  /sys/fs/cgroup
  tmpfs       919M  12% tmpfs    rw,nosuid,nodev                                  /run
  tmpfs       919M  12% tmpfs    rw,nosuid,nodev,mode=755                         /run
  tmpfs       919M  12% tmpfs    rw,nosuid,nodev,relatime,size=188200k,mode=700   /run
  tmpfs       919M  12% tmpfs    ro,nosuid,nodev,noexec,mode=755                  /run
# Disk Schedulers And Queue Size #############################
         vda | [mq-deadline] 256
# Disk Partioning ############################################
Device       Type      Start        End               Size
============ ==== ========== ========== ==================
/dev/vda     Disk                              21474836480
/dev/vda1    Part       2048   41940735        21472607744
# Kernel Inode State #########################################
dentry-state | 23654	13184	45	0	3753	0
     file-nr | 1088	0	182675
    inode-nr | 21228	1556
# LVM Volumes ################################################
Unable to collect information
# LVM Volume Groups ##########################################
Unable to collect information
# RAID Controller ############################################
  Controller | No RAID controller detected
# Network Config #############################################
  Controller | Red Hat, Inc. Virtio network device
 FIN Timeout | 60
  Port Range | 60999
# Interface Statistics #######################################
  interface  rx_bytes rx_packets  rx_errors   tx_bytes tx_packets  tx_errors
  ========= ========= ========== ========== ========== ========== ==========
  lo             6000         60          0       6000         60          0
  eth0      200000000     600000          0  100000000     600000          0
# Network Devices ############################################
  Device    Speed     Duplex
  ========= ========= =========
  eth0
# Top Processes ##############################################
  PID USER      PR  NI    VIRT    RES    SHR S %CPU %MEM     TIME+ COMMAND
    1 root      20   0  125512   2692   1360 S  0.0  0.1   0:15.29 systemd
    2 root      20   0       0      0      0 S  0.0  0.0   0:00.08 kthreadd
    4 root       0 -20       0      0      0 S  0.0  0.0   0:00.00 kworker/0:0H
    5 root      20   0       0      0      0 S  0.0  0.0   0:01.84 kworker/u2:0
    6 root      20   0       0      0      0 S  0.0  0.0   0:08.67 ksoftirqd/0
    7 root      rt   0       0      0      0 S  0.0  0.0   0:00.00 migration/0
    8 root      20   0       0      0      0 S  0.0  0.0   0:00.00 rcu_bh
    9 root      20   0       0      0      0 S  0.0  0.0   0:20.95 rcu_sched
   10 root       0 -20       0      0      0 S  0.0  0.0   0:00.00 lru-add-dra+
# Notable Processes ##########################################
  PID    OOM    COMMAND
  841    -17    sshd
# Memory management ##########################################
Transparent huge pages are enabled.
# The End ####################################################
Тесты
DD:
dd if=/dev/zero of=test bs=64k count=16k conv=fdatasync 2>&1
rm -f test
-----------
16384+0 records in
16384+0 records out
1073741824 bytes (1.1 GB) copied, 3.44349 s, 312 MB/s
16384+0 records in
16384+0 records out
1073741824 bytes (1.1 GB) copied, 1.40902 s, 762 MB/s
16384+0 records in
16384+0 records out
1073741824 bytes (1.1 GB) copied, 1.075 s, 999 MB/s
Скорость диска при линейном копировании тут тоже показывает не особо стабильные результаты. Но значения выше чем для VPS Shared.
Sysbench CPU:
Sysbench CPU:
====================================================
sysbench cpu --cpu-max-prime=20000 --num-threads=1 run
-----------
sysbench 1.0.17 (using system LuaJIT 2.0.4)

Running the test with following options:
Number of threads: 1
Initializing random number generator from current time


Prime numbers limit: 20000

Initializing worker threads...

Threads started!

CPU speed:
    events per second:   445.49

General statistics:
    total time:                          10.0003s
    total number of events:              4456

Latency (ms):
         min:                                    2.09
         avg:                                    2.24
         max:                                   20.04
         95th percentile:                        2.48
         sum:                                 9984.03

Threads fairness:
    events (avg/stddev):           4456.0000/0.00
    execution time (avg/stddev):   9.9840/0.00


Sysbench CPU Mutex 64:
====================================================
sysbench mutex --threads=64 run
-----------
sysbench 1.0.17 (using system LuaJIT 2.0.4)

Running the test with following options:
Number of threads: 64
Initializing random number generator from current time


Initializing worker threads...

Threads started!


General statistics:
    total time:                          19.5591s
    total number of events:              64

Latency (ms):
         min:                                17979.28
         avg:                                18955.81
         max:                                19517.77
         95th percentile:                    19425.29
         sum:                              1213171.99

Threads fairness:
    events (avg/stddev):           1.0000/0.00
    execution time (avg/stddev):   18.9558/0.30


Memory size for Sysbench Memory test: 1G
Disk space for Sysbench Disk test: 2G
Здесь тоже по тесту CPU все ок.
Sysbench Memory test:
И бенчмарк ОЗУ тоже в норме.
sysbench memory --num-threads=4 --memory-total-size=1G run
-----------
WARNING: --num-threads is deprecated, use --threads instead
sysbench 1.0.17 (using system LuaJIT 2.0.4)

Running the test with following options:
Number of threads: 4
Initializing random number generator from current time


Running memory speed test with the following options:
  block size: 1KiB
  total size: 1024MiB
  operation: write
  scope: global

Initializing worker threads...

Threads started!

Total operations: 1048576 (3073881.06 per second)

1024.00 MiB transferred (3001.84 MiB/sec)


General statistics:
    total time:                          0.3392s
    total number of events:              1048576

Latency (ms):
         min:                                    0.00
         avg:                                    0.00
         max:                                   44.04
         95th percentile:                        0.00
         sum:                                  402.24

Threads fairness:
    events (avg/stddev):           262144.0000/0.00
    execution time (avg/stddev):   0.1006/0.01
Sysbench Disk test:
Подготавливаем тестовые файлы.
sysbench fileio --file-total-size=2G prepare
-----------
sysbench 1.0.17 (using system LuaJIT 2.0.4)

128 files, 16384Kb each, 2048Mb total
Creating files for the test...
Extra file open flags: (none)
Creating file test_file.0
...
Creating file test_file.127
2147483648 bytes written in 5.15 seconds (397.40 MiB/sec).
Запускаем тест.
sysbench fileio --file-total-size=2G --file-test-mode=rndrw --time=300 --max-requests=0 run
-----------
sysbench 1.0.17 (using system LuaJIT 2.0.4)

Running the test with following options:
Number of threads: 1
Initializing random number generator from current time


Extra file open flags: (none)
128 files, 16MiB each
2GiB total file size
Block size 16KiB
Number of IO requests: 0
Read/Write ratio for combined random IO test: 1.50
Periodic FSYNC enabled, calling fsync() each 100 requests.
Calling fsync() at the end of test, Enabled.
Using synchronous I/O mode
Doing random r/w test
Initializing worker threads...

Threads started!


File operations:
    reads/s:                      873.31
    writes/s:                     582.20
    fsyncs/s:                     1863.46

Throughput:
    read, MiB/s:                  13.65
    written, MiB/s:               9.10

General statistics:
    total time:                          300.0528s
    total number of events:              995910

Latency (ms):
         min:                                    0.00
         avg:                                    0.30
         max:                                   80.95
         95th percentile:                        0.64
         sum:                               298464.68

Threads fairness:
    events (avg/stddev):           995910.0000/0.00
    execution time (avg/stddev):   298.4647/0.00
Тут результаты еще лучше чем для Shared VPS.
Speedtest cli:
Тут результаты такие же как для Shared VPS. Достойно)
speedtest-cli
-----------
Retrieving speedtest.net configuration...
Testing from OsetecNET (185.112.83.xx)...
Retrieving speedtest.net server list...
Selecting best server based on ping...
Hosted by Miranda-media Yevpatoria (Yevpatoria) [1232.83 km]: 47.556 ms
Testing download speed................................................................................
Download: 746.52 Mbit/s
Testing upload speed......................................................................................................
Upload: 352.79 Mbit/s
7-zip benchmark:
7za b
-----------

7-Zip (a) [64] 16.02 : Copyright (c) 1999-2016 Igor Pavlov : 2016-05-21
p7zip Version 16.02 (locale=en_US.UTF-8,Utf16=on,HugeFiles=on,64 bits,1 CPU AMD EPYC 7551P 32-Core Processor                (800F12),ASM,AES-NI)

AMD EPYC 7551P 32-Core Processor                (800F12)
CPU Freq:  2297  2130  2311  2211  1935  2303  2251  2259  2353

RAM size:    1837 MB,  # CPU hardware threads:   1
RAM usage:    435 MB,  # Benchmark threads:      1

                       Compressing  |                  Decompressing
Dict     Speed Usage    R/U Rating  |      Speed Usage    R/U Rating
         KiB/s     %   MIPS   MIPS  |      KiB/s     %   MIPS   MIPS

22:       1733   100   1693   1686  |      23884   100   2039   2039
23:       1567   100   1599   1597  |      22990   100   1989   1990
24:       1387   100   1495   1492  |      22325   100   1960   1960
25:       1342   100   1536   1533  |      22766   100   2025   2026
----------------------------------  | ------------------------------
Avr:             100   1581   1577  |              100   2003   2004
Tot:             100   1792   1790
Результаты бенчмарка 7-zip не выдающиеся.
Выводы
Интересный сервис со своими фишками. Виртуальные сервера средней производительности. Мне понравилась возможность почасовой аренды серверов, большое количество вариантов оплаты и популярные локации.