
Добрый день!
Написали мне тут на днях представители нового хостинга Hosting-russia с предложением потестировать их сервера. Цены здесь также бюджетные. Стомость сервера по самому дешевому тарифу “Социальный” - 50 рублей в месяц. За эти деньги нам предлагают 1 ядро CPU, 512Mb ОЗУ и 10 гигабайт места на SSD. На этом тарифе сетка 100 мегабит. На всех остальных тарифах 500 мегабит. Но действуют хитрые условия на использование трафика. Загрузить канал на 100% вам никто не даст)
Также по-умолчанию заблочены порты 25/465 в целях защиты от рассылки спама. Но при желании думаю это ограничение можно будет снять.
Я взял на тест 3 сервера разных тарифов - “Социальный”, “Стандарт” и “VIP”. Чуть ниже результаты тестов.
Вот что ответили представители хостера на вопрос о ДЦ и железе.
О дата-центре. Мы размещаемся в премиальных дата-центрах в Москве, среди них: Selectel / DataPRO / IXcellerate Корпоративных клиентов размещаем в своем приватном ДЦ. Каналы у нас свои, вне зависимости от ДЦ. IPv6 у нас нет. Оборудование преимущественно это e5-2680v2 2.8 Ггц / ddr 3 / SSD Intel корпоративного класса для ДЦ.
Панель управления
Здесь используется BillManager.
Доступные шаблоны ОС для установки.
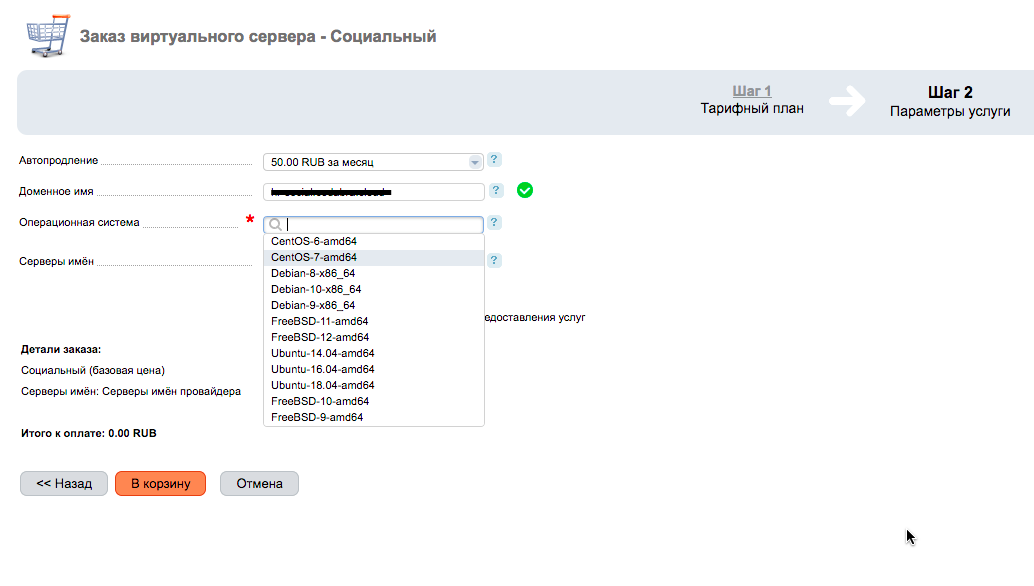
Тариф “Социальный”
На данном тарифе нет возможности докупить дополнительные ресурсы и дополнительные ip-адреса.
Distro:
====================================================
cat /etc/centos-release
-----------
CentOS Linux release 7.6.1810 (Core)

Kernel info:
====================================================
uname -a
-----------
Linux hr-social.xxx.xxx 3.10.0-957.27.2.el7.x86_64 #1 SMP Mon Jul 29 17:46:05 UTC 2019 x86_64 x86_64 x86_64 GNU/Linux

Inxi:
====================================================
inxi -b
-----------
System:    Host: hr-social.xxx.xxx Kernel: 3.10.0-957.27.2.el7.x86_64 x86_64 bits: 64 Console: N/A
           Distro: CentOS Linux release 7.6.1810 (Core)
Machine:   Type: Kvm System: Red Hat product: KVM v: RHEL 7.6.0 PC (i440FX + PIIX, 1996) serial: N/A
           Mobo: N/A model: N/A serial: N/A BIOS: SeaBIOS v: 1.11.0-2.el7 date: 04/01/2014
CPU:       Single Core: QEMU Virtual version 2.5+ type: MCP speed: 2800 MHz
Graphics:  Device-1: Cirrus Logic GD 5446 driver: cirrus v: kernel
           Display: server: No display server data found. Headless machine? tty: 202x25
           Message: Unable to show advanced data. Required tool glxinfo missing.
Network:   Device-1: Intel 82371AB/EB/MB PIIX4 ACPI type: network bridge driver: piix4_smbus
           Device-2: Red Hat Virtio network driver: virtio-pci
Drives:    Local Storage: total: 9.31 GiB used: 1.32 GiB (14.2%)
Info:      Processes: 77 Uptime: 5m Memory: 487.1 MiB used: 132.9 MiB (27.3%) Init: systemd runlevel: 3 Shell: test.sh
           inxi: 3.0.35

CPU Info:
====================================================
cat /proc/cpuinfo
-----------
processor	: 0
vendor_id	: GenuineIntel
cpu family	: 6
model		: 13
model name	: QEMU Virtual CPU version 2.5+
stepping	: 3
microcode	: 0x1
cpu MHz		: 2799.998
cache size	: 16384 KB
physical id	: 0
siblings	: 1
core id		: 0
cpu cores	: 1
apicid		: 0
initial apicid	: 0
fpu		: yes
fpu_exception	: yes
cpuid level	: 13
wp		: yes
flags		: fpu de pse tsc msr pae mce cx8 apic sep mtrr pge mca cmov pse36 clflush mmx fxsr sse sse2 syscall nx lm rep_good nopl xtopology eagerfpu pni cx16 x2apic hypervisor lahf_lm
bogomips	: 5599.99
clflush size	: 64
cache_alignment	: 64
address sizes	: 46 bits physical, 48 bits virtual
power management:


Memory Info:
====================================================
cat /proc/meminfo
-----------
MemTotal:         498796 kB
MemFree:           97740 kB
MemAvailable:     386280 kB
Buffers:              20 kB
Cached:           281188 kB
SwapCached:            0 kB
Active:           200264 kB
Inactive:         129560 kB
Active(anon):      48960 kB
Inactive(anon):     4148 kB
Active(file):     151304 kB
Inactive(file):   125412 kB
Unevictable:           0 kB
Mlocked:               0 kB
SwapTotal:             0 kB
SwapFree:              0 kB
Dirty:                 8 kB
Writeback:             0 kB
AnonPages:         48632 kB
Mapped:            17272 kB
Shmem:              4496 kB
Slab:              38728 kB
SReclaimable:      24936 kB
SUnreclaim:        13792 kB
KernelStack:        1440 kB
PageTables:         3276 kB
NFS_Unstable:          0 kB
Bounce:                0 kB
WritebackTmp:          0 kB
CommitLimit:      249396 kB
Committed_AS:     196148 kB
VmallocTotal:   34359738367 kB
VmallocUsed:        9060 kB
VmallocChunk:   34359723772 kB
HardwareCorrupted:     0 kB
AnonHugePages:         0 kB
CmaTotal:              0 kB
CmaFree:               0 kB
HugePages_Total:       0
HugePages_Free:        0
HugePages_Rsvd:        0
HugePages_Surp:        0
Hugepagesize:       2048 kB
DirectMap4k:       63344 kB
DirectMap2M:      460800 kB

Disk Info:
====================================================
df -HT
-----------
Файловая система Тип      Размер Использовано  Дост Использовано% Cмонтировано в
/dev/vda2        xfs        9,8G         1,4G  8,5G           14% /
devtmpfs         devtmpfs   244M            0  244M            0% /dev
tmpfs            tmpfs      256M            0  256M            0% /dev/shm
tmpfs            tmpfs      256M         4,7M  251M            2% /run
tmpfs            tmpfs      256M            0  256M            0% /sys/fs/cgroup
/dev/vda1        ext4       252M         103M  132M           44% /boot
tmpfs            tmpfs       52M            0   52M            0% /run/user/0

Percona Tools summary:
====================================================
pt-summary
-----------
# Percona Toolkit System Summary Report ######################
        Date | 2019-09-10 11:39:51 UTC (local TZ: MSK +0300)
    Hostname | hr-social.xxx.xxx
      Uptime | 5 min,  1 user,  load average: 0,22, 0,11, 0,04
      System | Red Hat; KVM; vRHEL 7.6.0 PC (i440FX + PIIX, 1996) (Other)
 Service Tag | Not Specified
    Platform | Linux
     Release | CentOS Linux release 7.6.1810 (Core)
      Kernel | 3.10.0-957.27.2.el7.x86_64
Architecture | CPU = 64-bit, OS = 64-bit
   Threading | NPTL 2.17
     SELinux | Disabled
 Virtualized | VMWare
# Processor ##################################################
  Processors | physical = 1, cores = 1, virtual = 1, hyperthreading = no
      Speeds | 1x2799.998
      Models | 1xQEMU Virtual CPU version 2.5+
      Caches | 1x16384 KB
# Memory #####################################################
       Total | 487,1M
        Free | 89,9M
        Used | physical = 80,3M, swap allocated = 0,0, swap used = 0,0, virtual = 80,3M
      Shared | 4,4M
     Buffers | 316,9M
      Caches | 376,0M
       Dirty | 88 kB
     UsedRSS | 100,6M
  Swappiness | 30
 DirtyPolicy | 30, 10
 DirtyStatus | 0, 0
  Locator   Size     Speed             Form Factor   Type          Type Detail
  ========= ======== ================= ============= ============= ===========
  DIMM 0    512 MB   Unknown           DIMM          RAM           Other
# Mounted Filesystems ########################################
  Filesystem  Size Used Type     Opts                                            Mountpoint
  devtmpfs    232M   0% devtmpfs rw,nosuid,size=237560k,nr_inodes=59390,mode=755 /dev
  /dev/vda1   240M  44% ext4     rw,relatime,data=ordered                        /boot
  /dev/vda2   9,1G  14% xfs      rw,relatime,attr2,inode64,noquota               /
  tmpfs       244M   0% tmpfs    rw,nosuid,nodev                                 /dev/shm
  tmpfs       244M   0% tmpfs    rw,nosuid,nodev,mode=755                        /dev/shm
  tmpfs       244M   0% tmpfs    rw,nosuid,nodev,relatime,size=49880k,mode=700   /dev/shm
  tmpfs       244M   0% tmpfs    ro,nosuid,nodev,noexec,mode=755                 /dev/shm
  tmpfs       244M   0% tmpfs    rw,nosuid,nodev                                 /sys/fs/cgroup
  tmpfs       244M   0% tmpfs    rw,nosuid,nodev,mode=755                        /sys/fs/cgroup
  tmpfs       244M   0% tmpfs    rw,nosuid,nodev,relatime,size=49880k,mode=700   /sys/fs/cgroup
  tmpfs       244M   0% tmpfs    ro,nosuid,nodev,noexec,mode=755                 /sys/fs/cgroup
  tmpfs       244M   2% tmpfs    rw,nosuid,nodev                                 /run
  tmpfs       244M   2% tmpfs    rw,nosuid,nodev,mode=755                        /run
  tmpfs       244M   2% tmpfs    rw,nosuid,nodev,relatime,size=49880k,mode=700   /run
  tmpfs       244M   2% tmpfs    ro,nosuid,nodev,noexec,mode=755                 /run
  tmpfs        49M   0% tmpfs    rw,nosuid,nodev                                 /run/user/0
  tmpfs        49M   0% tmpfs    rw,nosuid,nodev,mode=755                        /run/user/0
  tmpfs        49M   0% tmpfs    rw,nosuid,nodev,relatime,size=49880k,mode=700   /run/user/0
  tmpfs        49M   0% tmpfs    ro,nosuid,nodev,noexec,mode=755                 /run/user/0
# Disk Schedulers And Queue Size #############################
         vda | [mq-deadline] 256
# Disk Partioning ############################################
Device       Type      Start        End               Size
============ ==== ========== ========== ==================
/dev/vda     Disk                              10000269312
/dev/vda1    Part       2048     526335          268434944
/dev/vda2    Part     526336   19531775         9730784768
# Kernel Inode State #########################################
dentry-state | 28142	17828	45	0	0	0
     file-nr | 896	0	46614
    inode-nr | 19782	2459
# LVM Volumes ################################################
Unable to collect information
# LVM Volume Groups ##########################################
Unable to collect information
# RAID Controller ############################################
  Controller | No RAID controller detected
# Network Config #############################################
  Controller | Red Hat, Inc. Virtio network device
 FIN Timeout | 60
  Port Range | 60999
# Interface Statistics #######################################
  interface  rx_bytes rx_packets  rx_errors   tx_bytes tx_packets  tx_errors
  ========= ========= ========== ========== ========== ========== ==========
  lo                0          0          0          0          0          0
  eth0       45000000      20000          0    1000000       9000          0
# Network Devices ############################################
  Device    Speed     Duplex
  ========= ========= =========
  eth0
# Top Processes ##############################################
  PID USER      PR  NI    VIRT    RES    SHR S %CPU %MEM     TIME+ COMMAND
    1 root      20   0   43408   3680   2476 S  0,0  0,7   0:00.82 systemd
    2 root      20   0       0      0      0 S  0,0  0,0   0:00.00 kthreadd
    3 root      20   0       0      0      0 S  0,0  0,0   0:00.02 ksoftirqd/0
    5 root       0 -20       0      0      0 S  0,0  0,0   0:00.00 kworker/0:0H
    7 root      rt   0       0      0      0 S  0,0  0,0   0:00.00 migration/0
    8 root      20   0       0      0      0 S  0,0  0,0   0:00.00 rcu_bh
    9 root      20   0       0      0      0 R  0,0  0,0   0:00.28 rcu_sched
   10 root       0 -20       0      0      0 S  0,0  0,0   0:00.00 lru-add-dra+
   11 root      rt   0       0      0      0 S  0,0  0,0   0:00.00 watchdog/0
# Notable Processes ##########################################
  PID    OOM    COMMAND
  890    -17    sshd
# Memory mamagement ##########################################
Transparent huge pages are currently disabled on the system.
# The End ####################################################

Starting tests:
====================================================
====================================================

DD:
====================================================
dd if=/dev/zero of=test bs=64k count=16k conv=fdatasync 2>&1
rm -f test
-----------
16384+0 записей получено
16384+0 записей отправлено
 скопировано 1073741824 байта (1,1 GB), 2,64618 c, 406 MB/c
16384+0 записей получено
16384+0 записей отправлено
 скопировано 1073741824 байта (1,1 GB), 1,40918 c, 762 MB/c
16384+0 записей получено
16384+0 записей отправлено
 скопировано 1073741824 байта (1,1 GB), 2,21474 c, 485 MB/c

Sysbench CPU:
====================================================
sysbench cpu --cpu-max-prime=20000 --num-threads=1 run
-----------
sysbench 1.0.17 (using system LuaJIT 2.0.4)

Running the test with following options:
Number of threads: 1
Initializing random number generator from current time


Prime numbers limit: 20000

Initializing worker threads...

Threads started!

CPU speed:
    events per second:   295.75

General statistics:
    total time:                          10.0038s
    total number of events:              2960

Latency (ms):
         min:                                    2.95
         avg:                                    3.37
         max:                                   11.94
         95th percentile:                        3.55
         sum:                                 9981.47

Threads fairness:
    events (avg/stddev):           2960.0000/0.00
    execution time (avg/stddev):   9.9815/0.00


Sysbench CPU Mutex 64:
====================================================
sysbench mutex --threads=64 run
-----------
sysbench 1.0.17 (using system LuaJIT 2.0.4)

Running the test with following options:
Number of threads: 64
Initializing random number generator from current time


Initializing worker threads...

Threads started!


General statistics:
    total time:                          11.7352s
    total number of events:              64

Latency (ms):
         min:                                10516.23
         avg:                                11218.22
         max:                                11687.37
         95th percentile:                    11523.48
         sum:                               717966.11

Threads fairness:
    events (avg/stddev):           1.0000/0.00
    execution time (avg/stddev):   11.2182/0.25


Memory size for Sysbench Memory test: 512M
Disk space for Sysbench Disk test: 1G
Sysbench Memory test:
====================================================
sysbench memory --num-threads=4 --memory-total-size=512M run
-----------
WARNING: --num-threads is deprecated, use --threads instead
sysbench 1.0.17 (using system LuaJIT 2.0.4)

Running the test with following options:
Number of threads: 4
Initializing random number generator from current time


Running memory speed test with the following options:
  block size: 1KiB
  total size: 512MiB
  operation: write
  scope: global

Initializing worker threads...

Threads started!

Total operations: 524288 (4034341.30 per second)

512.00 MiB transferred (3939.79 MiB/sec)


General statistics:
    total time:                          0.1281s
    total number of events:              524288

Latency (ms):
         min:                                    0.00
         avg:                                    0.00
         max:                                   52.09
         95th percentile:                        0.00
         sum:                                  232.93

Threads fairness:
    events (avg/stddev):           131072.0000/0.00
    execution time (avg/stddev):   0.0582/0.03


Sysbench Disk test:
====================================================
sysbench fileio --file-total-size=1G prepare
-----------
sysbench 1.0.17 (using system LuaJIT 2.0.4)

128 files, 8192Kb each, 1024Mb total
Creating files for the test...
Extra file open flags: (none)
Creating file test_file.0
...
Creating file test_file.127
1073741824 bytes written in 6.24 seconds (164.03 MiB/sec).
sysbench fileio --file-total-size=1G --file-test-mode=rndrw --time=300 --max-requests=0 run
-----------
sysbench 1.0.17 (using system LuaJIT 2.0.4)

Running the test with following options:
Number of threads: 1
Initializing random number generator from current time


Extra file open flags: (none)
128 files, 8MiB each
1GiB total file size
Block size 16KiB
Number of IO requests: 0
Read/Write ratio for combined random IO test: 1.50
Periodic FSYNC enabled, calling fsync() each 100 requests.
Calling fsync() at the end of test, Enabled.
Using synchronous I/O mode
Doing random r/w test
Initializing worker threads...

Threads started!


File operations:
    reads/s:                      267.06
    writes/s:                     178.04
    fsyncs/s:                     569.85

Throughput:
    read, MiB/s:                  4.17
    written, MiB/s:               2.78

General statistics:
    total time:                          300.1516s
    total number of events:              304513

Latency (ms):
         min:                                    0.00
         avg:                                    0.98
         max:                                  222.50
         95th percentile:                        5.67
         sum:                               299591.27

Threads fairness:
    events (avg/stddev):           304513.0000/0.00
    execution time (avg/stddev):   299.5913/0.00


Speedtest cli:
====================================================
speedtest-cli
-----------
Retrieving speedtest.net configuration...
Testing from Argotel ANTIDDOS-HOSTING (95.182.122.119)...
Retrieving speedtest.net server list...
Selecting best server based on ping...
Hosted by Orange Business Services, Russia & CIS (Moscow) [0.12 km]: 3.264 ms
Testing download speed................................................................................
Download: 104.70 Mbit/s
Testing upload speed....................................................................................................
Upload: 158.38 Mbit/s
Выводы:
Тест 7-zip на этой конфигурации упал от нехватки ресурсов, но остальное все прошло успешно.
Решил сравнить ключевые параметры сервера с похожими конфигурациями других хостеров.
- /2017/12/special-databor/ (уже не существует)
- /2017/12/vscale-512mb/
- /2018/08/ihor-minimus/
CPU Mhz (больше лучше)
2799.998 vs 2199.998 (databor) vs 2199.976 (vscale) vs 2400.084 (ihor)

Скорость линейной записи на диск через dd (больше лучше)
~485 MB/c vs ~387 MB/s (databor) vs ~530 MB/s (databor) vs ~77,1 MB/c (ihor, тут HDD)

sysbench --test=cpu --cpu-max-prime=20000 --num-threads=1 run (больше лучше)
2960 vs 2971 (databor) vs 3368 (vscale) vs 2655 (ihor)

sysbench --test=mutex --num-threads=64 run (меньше лучше)
11.7352s vs 0.1790s (databor) vs 11.9590s (vscale) vs 27.7733s (ihor)

sysbench memory --num-threads=4 --memory-total-size=512M run (меньше лучше)
0.1281s vs 0.1946s (databor) vs 0.2427s (vscale) vs 0.1691s (ihor)

sysbench fileio --file-total-size=1G --file-test-mode=rndrw --time=300 --max-requests=0 run (больше лучше)
read, MiB/s: 4.17, written, MiB/s: 2.78 vs read, MiB/s: 28.42, written, MiB/s: 18.95 (databor) vs read, MiB/s: 24.42, written, MiB/s: 16.28 (vscale) vs read, MiB/s: 0.41, written, MiB/s: 0.27 (ihor)

Пинг из Ульяновска
20.771 ms vs 31.205ms (databor) vs 33.217 ms (vscale) vs 21.174 ms (ihor)
Короче результаты получились в целом средние. Но за 50 рублей это прям хорошо.
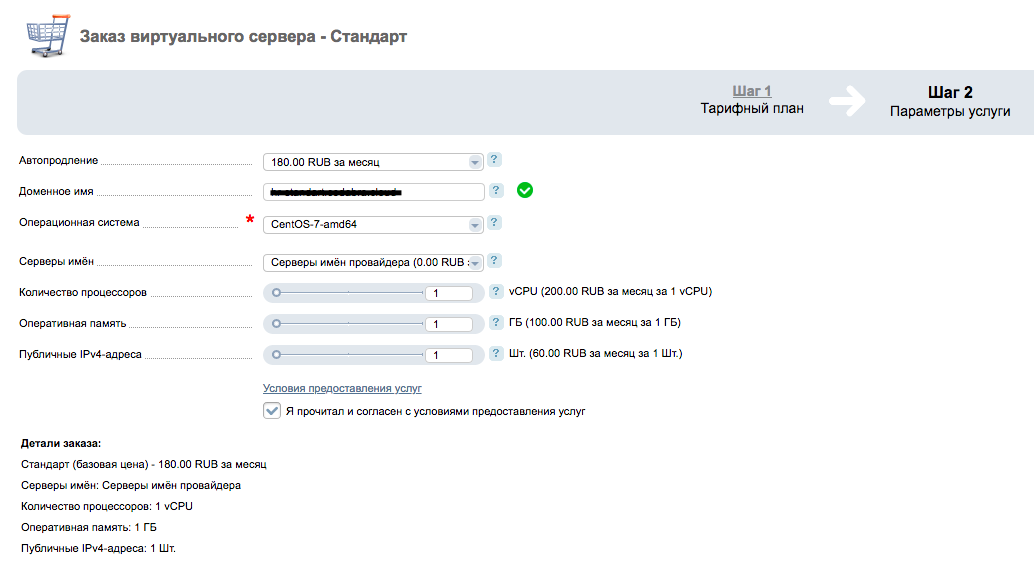
Тариф “Стандарт”
1 CPU, 1Gb ОЗУ, 20Gb SSD - 180 рублей/месяц.
Здесь можно докупить IP-адреса, ядра CPU и ОЗУ. IP-адрес 60 руб/месяц, 1 ядро vCPU - 200 руб/месяц, 1Gb ОЗУ - 100 руб/месяц.
Distro:
====================================================
cat /etc/centos-release
-----------
CentOS Linux release 7.6.1810 (Core)

Kernel info:
====================================================
uname -a
-----------
Linux hr-standart.xxx.xxx 3.10.0-957.27.2.el7.x86_64 #1 SMP Mon Jul 29 17:46:05 UTC 2019 x86_64 x86_64 x86_64 GNU/Linux

Inxi:
====================================================
inxi -b
-----------
System:    Host: hr-standart.xxx.xxx Kernel: 3.10.0-957.27.2.el7.x86_64 x86_64 bits: 64 Console: N/A
           Distro: CentOS Linux release 7.6.1810 (Core)
Machine:   Type: Kvm System: Red Hat product: KVM v: RHEL 7.6.0 PC (i440FX + PIIX, 1996) serial: N/A
           Mobo: N/A model: N/A serial: N/A BIOS: SeaBIOS v: 1.11.0-2.el7 date: 04/01/2014
CPU:       Single Core: QEMU Virtual version 2.5+ type: MCP speed: 3300 MHz
Graphics:  Device-1: Cirrus Logic GD 5446 driver: cirrus v: kernel
           Display: server: No display server data found. Headless machine? tty: 202x25
           Message: Unable to show advanced data. Required tool glxinfo missing.
Network:   Device-1: Intel 82371AB/EB/MB PIIX4 ACPI type: network bridge driver: piix4_smbus
           Device-2: Red Hat Virtio network driver: virtio-pci
Drives:    Local Storage: total: 18.63 GiB used: 1.33 GiB (7.2%)
Info:      Processes: 78 Uptime: 21m Memory: 991.1 MiB used: 142.1 MiB (14.3%) Init: systemd runlevel: 3 Shell: test.sh
           inxi: 3.0.35

CPU Info:
====================================================
cat /proc/cpuinfo
-----------
processor	: 0
vendor_id	: GenuineIntel
cpu family	: 6
model		: 13
model name	: QEMU Virtual CPU version 2.5+
stepping	: 3
microcode	: 0x1
cpu MHz		: 3299.998
cache size	: 16384 KB
physical id	: 0
siblings	: 1
core id		: 0
cpu cores	: 1
apicid		: 0
initial apicid	: 0
fpu		: yes
fpu_exception	: yes
cpuid level	: 13
wp		: yes
flags		: fpu de pse tsc msr pae mce cx8 apic sep mtrr pge mca cmov pse36 clflush mmx fxsr sse sse2 syscall nx lm rep_good nopl xtopology eagerfpu pni cx16 x2apic hypervisor lahf_lm
bogomips	: 6599.99
clflush size	: 64
cache_alignment	: 64
address sizes	: 46 bits physical, 48 bits virtual
power management:


Memory Info:
====================================================
cat /proc/meminfo
-----------
MemTotal:        1014876 kB
MemFree:          498980 kB
MemAvailable:     765736 kB
Buffers:            2088 kB
Cached:           384712 kB
SwapCached:            0 kB
Active:           271500 kB
Inactive:         166872 kB
Active(anon):      51936 kB
Inactive(anon):     6396 kB
Active(file):     219564 kB
Inactive(file):   160476 kB
Unevictable:           0 kB
Mlocked:               0 kB
SwapTotal:             0 kB
SwapFree:              0 kB
Dirty:             16204 kB
Writeback:             0 kB
AnonPages:         51636 kB
Mapped:            17736 kB
Shmem:              6744 kB
Slab:              42188 kB
SReclaimable:      28984 kB
SUnreclaim:        13204 kB
KernelStack:        1456 kB
PageTables:         3268 kB
NFS_Unstable:          0 kB
Bounce:                0 kB
WritebackTmp:          0 kB
CommitLimit:      507436 kB
Committed_AS:     198564 kB
VmallocTotal:   34359738367 kB
VmallocUsed:        9956 kB
VmallocChunk:   34359719676 kB
HardwareCorrupted:     0 kB
AnonHugePages:      4096 kB
CmaTotal:              0 kB
CmaFree:               0 kB
HugePages_Total:       0
HugePages_Free:        0
HugePages_Rsvd:        0
HugePages_Surp:        0
Hugepagesize:       2048 kB
DirectMap4k:       51056 kB
DirectMap2M:      997376 kB

Disk Info:
====================================================
df -HT
-----------
Файловая система Тип      Размер Использовано  Дост Использовано% Cмонтировано в
/dev/vda2        xfs         20G         1,4G   19G            7% /
devtmpfs         devtmpfs   508M            0  508M            0% /dev
tmpfs            tmpfs      520M            0  520M            0% /dev/shm
tmpfs            tmpfs      520M         7,0M  513M            2% /run
tmpfs            tmpfs      520M            0  520M            0% /sys/fs/cgroup
/dev/vda1        ext4       252M         103M  132M           44% /boot
tmpfs            tmpfs      104M            0  104M            0% /run/user/0

Percona Tools summary:
====================================================
pt-summary
-----------
# Percona Toolkit System Summary Report ######################
        Date | 2019-09-10 11:59:34 UTC (local TZ: MSK +0300)
    Hostname | hr-standart.xxx.xxx
      Uptime | 21 min,  1 user,  load average: 0,57, 0,21, 0,10
      System | Red Hat; KVM; vRHEL 7.6.0 PC (i440FX + PIIX, 1996) (Other)
 Service Tag | Not Specified
    Platform | Linux
     Release | CentOS Linux release 7.6.1810 (Core)
      Kernel | 3.10.0-957.27.2.el7.x86_64
Architecture | CPU = 64-bit, OS = 64-bit
   Threading | NPTL 2.17
     SELinux | Disabled
 Virtualized | VMWare
# Processor ##################################################
  Processors | physical = 1, cores = 1, virtual = 1, hyperthreading = no
      Speeds | 1x3299.998
      Models | 1xQEMU Virtual CPU version 2.5+
      Caches | 1x16384 KB
# Memory #####################################################
       Total | 991,1M
        Free | 482,4M
        Used | physical = 86,2M, swap allocated = 0,0, swap used = 0,0, virtual = 86,2M
      Shared | 6,6M
     Buffers | 422,5M
      Caches | 746,0M
       Dirty | 16308 kB
     UsedRSS | 104,3M
  Swappiness | 30
 DirtyPolicy | 30, 10
 DirtyStatus | 0, 0
  Locator   Size     Speed             Form Factor   Type          Type Detail
  ========= ======== ================= ============= ============= ===========
  DIMM 0    1024 MB  Unknown           DIMM          RAM           Other
# Mounted Filesystems ########################################
  Filesystem  Size Used Type     Opts                                             Mountpoint
  devtmpfs    484M   0% devtmpfs rw,nosuid,size=495600k,nr_inodes=123900,mode=755 /dev
  /dev/vda1   240M  44% ext4     rw,relatime,data=ordered                         /boot
  /dev/vda2    19G   7% xfs      rw,relatime,attr2,inode64,noquota                /
  tmpfs       100M   0% tmpfs    rw,nosuid,nodev                                  /run/user/0
  tmpfs       100M   0% tmpfs    rw,nosuid,nodev,mode=755                         /run/user/0
  tmpfs       100M   0% tmpfs    rw,nosuid,nodev,relatime,size=101488k,mode=700   /run/user/0
  tmpfs       100M   0% tmpfs    ro,nosuid,nodev,noexec,mode=755                  /run/user/0
  tmpfs       496M   0% tmpfs    rw,nosuid,nodev                                  /dev/shm
  tmpfs       496M   0% tmpfs    rw,nosuid,nodev,mode=755                         /dev/shm
  tmpfs       496M   0% tmpfs    rw,nosuid,nodev,relatime,size=101488k,mode=700   /dev/shm
  tmpfs       496M   0% tmpfs    ro,nosuid,nodev,noexec,mode=755                  /dev/shm
  tmpfs       496M   0% tmpfs    rw,nosuid,nodev                                  /sys/fs/cgroup
  tmpfs       496M   0% tmpfs    rw,nosuid,nodev,mode=755                         /sys/fs/cgroup
  tmpfs       496M   0% tmpfs    rw,nosuid,nodev,relatime,size=101488k,mode=700   /sys/fs/cgroup
  tmpfs       496M   0% tmpfs    ro,nosuid,nodev,noexec,mode=755                  /sys/fs/cgroup
  tmpfs       496M   2% tmpfs    rw,nosuid,nodev                                  /run
  tmpfs       496M   2% tmpfs    rw,nosuid,nodev,mode=755                         /run
  tmpfs       496M   2% tmpfs    rw,nosuid,nodev,relatime,size=101488k,mode=700   /run
  tmpfs       496M   2% tmpfs    ro,nosuid,nodev,noexec,mode=755                  /run
# Disk Schedulers And Queue Size #############################
         vda | [mq-deadline] 256
# Disk Partioning ############################################
Device       Type      Start        End               Size
============ ==== ========== ========== ==================
/dev/vda     Disk                              20000538624
/dev/vda1    Part       2048     526335          268434944
/dev/vda2    Part     526336   39063551        19731054080
# Kernel Inode State #########################################
dentry-state | 40532	29918	45	0	0	0
     file-nr | 896	0	97801
    inode-nr | 19829	295
# LVM Volumes ################################################
Unable to collect information
# LVM Volume Groups ##########################################
Unable to collect information
# RAID Controller ############################################
  Controller | No RAID controller detected
# Network Config #############################################
  Controller | Red Hat, Inc. Virtio network device
 FIN Timeout | 60
  Port Range | 60999
# Interface Statistics #######################################
  interface  rx_bytes rx_packets  rx_errors   tx_bytes tx_packets  tx_errors
  ========= ========= ========== ========== ========== ========== ==========
  lo                0          0          0          0          0          0
  eth0       45000000      30000          0     900000       6000          0
# Network Devices ############################################
  Device    Speed     Duplex
  ========= ========= =========
  eth0
# Top Processes ##############################################
  PID USER      PR  NI    VIRT    RES    SHR S %CPU %MEM     TIME+ COMMAND
    1 root      20   0   43408   3688   2476 S  0,0  0,4   0:01.01 systemd
    2 root      20   0       0      0      0 S  0,0  0,0   0:00.00 kthreadd
    3 root      20   0       0      0      0 S  0,0  0,0   0:00.17 ksoftirqd/0
    5 root       0 -20       0      0      0 S  0,0  0,0   0:00.00 kworker/0:0H
    6 root      20   0       0      0      0 S  0,0  0,0   0:00.00 kworker/u2:0
    7 root      rt   0       0      0      0 S  0,0  0,0   0:00.00 migration/0
    8 root      20   0       0      0      0 S  0,0  0,0   0:00.00 rcu_bh
    9 root      20   0       0      0      0 S  0,0  0,0   0:00.88 rcu_sched
   10 root       0 -20       0      0      0 S  0,0  0,0   0:00.00 lru-add-dra+
# Notable Processes ##########################################
  PID    OOM    COMMAND
  915    -17    sshd
# Memory mamagement ##########################################
Transparent huge pages are enabled.
# The End ####################################################

Starting tests:
====================================================
====================================================

DD:
====================================================
dd if=/dev/zero of=test bs=64k count=16k conv=fdatasync 2>&1
rm -f test
-----------
16384+0 записей получено
16384+0 записей отправлено
 скопировано 1073741824 байта (1,1 GB), 4,32642 c, 248 MB/c
16384+0 записей получено
16384+0 записей отправлено
 скопировано 1073741824 байта (1,1 GB), 2,87597 c, 373 MB/c
16384+0 записей получено
16384+0 записей отправлено
 скопировано 1073741824 байта (1,1 GB), 3,03825 c, 353 MB/c

Sysbench CPU:
====================================================
sysbench cpu --cpu-max-prime=20000 --num-threads=1 run
-----------
sysbench 1.0.17 (using system LuaJIT 2.0.4)

Running the test with following options:
Number of threads: 1
Initializing random number generator from current time


Prime numbers limit: 20000

Initializing worker threads...

Threads started!

CPU speed:
    events per second:   306.58

General statistics:
    total time:                          10.0018s
    total number of events:              3067

Latency (ms):
         min:                                    2.72
         avg:                                    3.25
         max:                                   38.83
         95th percentile:                        4.41
         sum:                                 9972.95

Threads fairness:
    events (avg/stddev):           3067.0000/0.00
    execution time (avg/stddev):   9.9730/0.00


Sysbench CPU Mutex 64:
====================================================
sysbench mutex --threads=64 run
-----------
sysbench 1.0.17 (using system LuaJIT 2.0.4)

Running the test with following options:
Number of threads: 64
Initializing random number generator from current time


Initializing worker threads...

Threads started!


General statistics:
    total time:                          17.4824s
    total number of events:              64

Latency (ms):
         min:                                15951.75
         avg:                                16889.65
         max:                                17423.78
         95th percentile:                    17435.99
         sum:                              1080937.81

Threads fairness:
    events (avg/stddev):           1.0000/0.00
    execution time (avg/stddev):   16.8897/0.35


Memory size for Sysbench Memory test: 1G
Disk space for Sysbench Disk test: 2G
Sysbench Memory test:
====================================================
sysbench memory --num-threads=4 --memory-total-size=1G run
-----------
WARNING: --num-threads is deprecated, use --threads instead
sysbench 1.0.17 (using system LuaJIT 2.0.4)

Running the test with following options:
Number of threads: 4
Initializing random number generator from current time


Running memory speed test with the following options:
  block size: 1KiB
  total size: 1024MiB
  operation: write
  scope: global

Initializing worker threads...

Threads started!

Total operations: 1048576 (2945436.40 per second)

1024.00 MiB transferred (2876.40 MiB/sec)


General statistics:
    total time:                          0.3537s
    total number of events:              1048576

Latency (ms):
         min:                                    0.00
         avg:                                    0.00
         max:                                   65.04
         95th percentile:                        0.00
         sum:                                  600.91

Threads fairness:
    events (avg/stddev):           262144.0000/0.00
    execution time (avg/stddev):   0.1502/0.07


Sysbench Disk test:
====================================================
sysbench fileio --file-total-size=2G prepare
-----------
sysbench 1.0.17 (using system LuaJIT 2.0.4)

128 files, 16384Kb each, 2048Mb total
Creating files for the test...
Extra file open flags: (none)
Creating file test_file.0
...
Creating file test_file.127
2147483648 bytes written in 10.91 seconds (187.73 MiB/sec).
sysbench fileio --file-total-size=2G --file-test-mode=rndrw --time=300 --max-requests=0 run
-----------
sysbench 1.0.17 (using system LuaJIT 2.0.4)

Running the test with following options:
Number of threads: 1
Initializing random number generator from current time


Extra file open flags: (none)
128 files, 16MiB each
2GiB total file size
Block size 16KiB
Number of IO requests: 0
Read/Write ratio for combined random IO test: 1.50
Periodic FSYNC enabled, calling fsync() each 100 requests.
Calling fsync() at the end of test, Enabled.
Using synchronous I/O mode
Doing random r/w test
Initializing worker threads...

Threads started!


File operations:
    reads/s:                      724.79
    writes/s:                     483.20
    fsyncs/s:                     1546.50

Throughput:
    read, MiB/s:                  11.32
    written, MiB/s:               7.55

General statistics:
    total time:                          300.0811s
    total number of events:              826454

Latency (ms):
         min:                                    0.00
         avg:                                    0.36
         max:                                   93.54
         95th percentile:                        1.23
         sum:                               297231.87

Threads fairness:
    events (avg/stddev):           826454.0000/0.00
    execution time (avg/stddev):   297.2319/0.00


Speedtest cli:
====================================================
speedtest-cli
-----------
Retrieving speedtest.net configuration...
Testing from Argotel ANTIDDOS-HOSTING (95.182.122.121)...
Retrieving speedtest.net server list...
Selecting best server based on ping...
Hosted by Net By Net Holding LLC (Moscow) [0.12 km]: 5.324 ms
Testing download speed................................................................................
Download: 1.69 Mbit/s
Testing upload speed....................................................................................................
Upload: 1.66 Mbit/s

7-zip benchmark:
====================================================
7za b
-----------

7-Zip (a) [64] 16.02 : Copyright (c) 1999-2016 Igor Pavlov : 2016-05-21
p7zip Version 16.02 (locale=ru_RU.UTF-8,Utf16=on,HugeFiles=on,64 bits,1 CPU QEMU Virtual CPU version 2.5+ (6D3),ASM)

QEMU Virtual CPU version 2.5+ (6D3)
CPU Freq:  3454  3473  3479  3462  3054  3335  3223  3336  2618

RAM size:     991 MB,  # CPU hardware threads:   1
RAM usage:    435 MB,  # Benchmark threads:      1

                       Compressing  |                  Decompressing
Dict     Speed Usage    R/U Rating  |      Speed Usage    R/U Rating
         KiB/s     %   MIPS   MIPS  |      KiB/s     %   MIPS   MIPS

22:       2155    94   2230   2096  |      33129    97   2901   2829
23:       1969    92   2191   2007  |      27352    91   2592   2368
24:       1555    89   1871   1672  |      29068    93   2747   2552
25:       1414    90   1797   1615  |      29207    96   2714   2600
----------------------------------  | ------------------------------
Avr:              91   2022   1848  |               94   2739   2587
Tot:              93   2380   2217
Выводы:
Решил сравнить ключевые параметры сервера с похожими конфигурациями других хостеров.
- /2018/06/firstvds-nvme-start/ 379 рублей в месяц
- /2018/08/vdsina-1gb/ 249 рублей в месяц
- /2018/11/adman-vds-step1/ 300 рублей в месяц
- /2016/10/arubacloud-vps-1gb/ ~71 рубль в месяц
- /2019/06/pq/ ~71 рубль в месяц
CPU Mhz (больше лучше)
3299.998 vs 2394.374 (firstvds) vs 2095.076 (vdsina) vs 2793.269 (adman) vs 1699.998 (aruba) vs 2793.268 (pq)

Скорость линейной записи на диск через dd (больше лучше)
~300 MB/c vs ~500 MB/s (firstvds) vs ~950 MB/s (vdsina) vs ~587 MB/c (adman) vs 1Gb/s (aruba) vs ~300 MB/s (pq)

sysbench --test=cpu --cpu-max-prime=20000 --num-threads=1 run (больше лучше)
3067 vs 3627 (firstvds) vs 2883 (vdsina) vs 3497 (adman) vs 3123 (pq)

sysbench --test=mutex --num-threads=64 run (больше лучше)
17.4824s vs 12.0053s (firstvds) vs 19.0590s (vdsina) vs 12.1056s (adman) vs 0.2024s (aruba) vs 11.2793s (pq)

sysbench memory --num-threads=4 --memory-total-size=1G run (меньше лучше)
0.3537s vs 0.3344s (firstvds) vs 0.3812s (vdsina) vs 0.2663s (adman) vs 0.4919s (aruba)

sysbench fileio --file-total-size=2G --file-test-mode=rndrw --time=300 --max-requests=0 run (больше лучше)
read, MiB/s: 11.32, written, MiB/s: 7.55 vs read, MiB/s: 60.57, written, MiB/s: 40.38 (firstvds) vs read, MiB/s: 39.95, written, MiB/s: 26.63 (vdsina) vs read, MiB/s: 22.95, written, MiB/s: 15.30 (adman)

Пинг из Ульяновска
20.771 ms vs 21.047 ms (firstvds) vs 21.012 ms (vdsina) vs 100 ms (aruba) vs 20.326 ms (pq)
Тут в целом тоже все по среднему. Стоимость 180 рублей в месяц и средние результаты. Короче неплохой вариант)
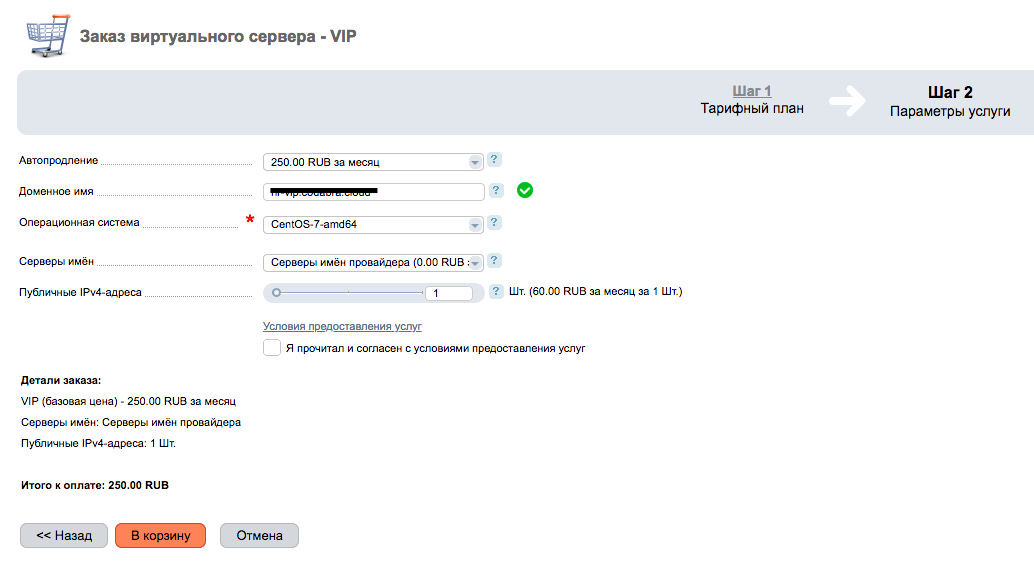
Тариф “VIP”
1 CPU, 2Gb ОЗУ, 30Gb SSD - 250 рублей/месяц. Здесь можно докупить только IP-адреса по 60 рублей в месяц.
Distro:
====================================================
cat /etc/centos-release
-----------
CentOS Linux release 7.6.1810 (Core)

Kernel info:
====================================================
uname -a
-----------
Linux hr-vip.xxx.xxx 3.10.0-957.27.2.el7.x86_64 #1 SMP Mon Jul 29 17:46:05 UTC 2019 x86_64 x86_64 x86_64 GNU/Linux

Inxi:
====================================================
inxi -b
-----------
System:    Host: hr-vip.xxx.xxx Kernel: 3.10.0-957.27.2.el7.x86_64 x86_64 bits: 64 Console: N/A
           Distro: CentOS Linux release 7.6.1810 (Core)
Machine:   Type: Kvm System: Red Hat product: KVM v: RHEL 7.6.0 PC (i440FX + PIIX, 1996) serial: N/A
           Mobo: N/A model: N/A serial: N/A BIOS: SeaBIOS v: 1.11.0-2.el7 date: 04/01/2014
CPU:       Single Core: QEMU Virtual version 2.5+ type: MCP speed: 3300 MHz
Graphics:  Device-1: Cirrus Logic GD 5446 driver: cirrus v: kernel
           Display: server: No display server data found. Headless machine? tty: 202x25
           Message: Unable to show advanced data. Required tool glxinfo missing.
Network:   Device-1: Intel 82371AB/EB/MB PIIX4 ACPI type: network bridge driver: piix4_smbus
           Device-2: Red Hat Virtio network driver: virtio-pci
Drives:    Local Storage: total: 27.94 GiB used: 1.37 GiB (4.9%)
Info:      Processes: 78 Uptime: 12m Memory: 1.80 GiB used: 155.0 MiB (8.4%) Init: systemd runlevel: 3 Shell: test.sh
           inxi: 3.0.35

CPU Info:
====================================================
cat /proc/cpuinfo
-----------
processor	: 0
vendor_id	: GenuineIntel
cpu family	: 6
model		: 13
model name	: QEMU Virtual CPU version 2.5+
stepping	: 3
microcode	: 0x1
cpu MHz		: 3299.998
cache size	: 16384 KB
physical id	: 0
siblings	: 1
core id		: 0
cpu cores	: 1
apicid		: 0
initial apicid	: 0
fpu		: yes
fpu_exception	: yes
cpuid level	: 13
wp		: yes
flags		: fpu de pse tsc msr pae mce cx8 apic sep mtrr pge mca cmov pse36 clflush mmx fxsr sse sse2 syscall nx lm rep_good nopl xtopology eagerfpu pni cx16 x2apic hypervisor lahf_lm
bogomips	: 6599.99
clflush size	: 64
cache_alignment	: 64
address sizes	: 46 bits physical, 48 bits virtual
power management:


Memory Info:
====================================================
cat /proc/meminfo
-----------
MemTotal:        1882204 kB
MemFree:         1296632 kB
MemAvailable:    1617736 kB
Buffers:            2104 kB
Cached:           440848 kB
SwapCached:            0 kB
Active:           292536 kB
Inactive:         202024 kB
Active(anon):      51928 kB
Inactive(anon):     8248 kB
Active(file):     240608 kB
Inactive(file):   193776 kB
Unevictable:           0 kB
Mlocked:               0 kB
SwapTotal:             0 kB
SwapFree:              0 kB
Dirty:             76984 kB
Writeback:             0 kB
AnonPages:         51584 kB
Mapped:            18336 kB
Shmem:              8600 kB
Slab:              48108 kB
SReclaimable:      35768 kB
SUnreclaim:        12340 kB
KernelStack:        1504 kB
PageTables:         3228 kB
NFS_Unstable:          0 kB
Bounce:                0 kB
WritebackTmp:          0 kB
CommitLimit:      941100 kB
Committed_AS:     200252 kB
VmallocTotal:   34359738367 kB
VmallocUsed:       11748 kB
VmallocChunk:   34359719676 kB
HardwareCorrupted:     0 kB
AnonHugePages:      4096 kB
CmaTotal:              0 kB
CmaFree:               0 kB
HugePages_Total:       0
HugePages_Free:        0
HugePages_Rsvd:        0
HugePages_Surp:        0
Hugepagesize:       2048 kB
DirectMap4k:       59248 kB
DirectMap2M:     2037760 kB

Disk Info:
====================================================
df -HT
-----------
Файловая система Тип      Размер Использовано  Дост Использовано% Cмонтировано в
/dev/vda2        xfs         30G         1,4G   29G            5% /
devtmpfs         devtmpfs   952M            0  952M            0% /dev
tmpfs            tmpfs      964M            0  964M            0% /dev/shm
tmpfs            tmpfs      964M         8,9M  955M            1% /run
tmpfs            tmpfs      964M            0  964M            0% /sys/fs/cgroup
/dev/vda1        ext4       252M         114M  121M           49% /boot
tmpfs            tmpfs      193M            0  193M            0% /run/user/0

Percona Tools summary:
====================================================
pt-summary
-----------
# Percona Toolkit System Summary Report ######################
        Date | 2019-09-10 11:49:58 UTC (local TZ: MSK +0300)
    Hostname | hr-vip.xxx.xxx
      Uptime | 12 min,  1 user,  load average: 0,61, 0,21, 0,10
      System | Red Hat; KVM; vRHEL 7.6.0 PC (i440FX + PIIX, 1996) (Other)
 Service Tag | Not Specified
    Platform | Linux
     Release | CentOS Linux release 7.6.1810 (Core)
      Kernel | 3.10.0-957.27.2.el7.x86_64
Architecture | CPU = 64-bit, OS = 64-bit
   Threading | NPTL 2.17
     SELinux | Disabled
 Virtualized | VMWare
# Processor ##################################################
  Processors | physical = 1, cores = 1, virtual = 1, hyperthreading = no
      Speeds | 1x3299.998
      Models | 1xQEMU Virtual CPU version 2.5+
      Caches | 1x16384 KB
# Memory #####################################################
       Total | 1,8G
        Free | 1,2G
        Used | physical = 93,4M, swap allocated = 0,0, swap used = 0,0, virtual = 93,4M
      Shared | 8,4M
     Buffers | 483,2M
      Caches | 1,5G
       Dirty | 77048 kB
     UsedRSS | 105,0M
  Swappiness | 30
 DirtyPolicy | 30, 10
 DirtyStatus | 0, 0
  Locator   Size     Speed             Form Factor   Type          Type Detail
  ========= ======== ================= ============= ============= ===========
  DIMM 0    2048 MB  Unknown           DIMM          RAM           Other
# Mounted Filesystems ########################################
  Filesystem  Size Used Type     Opts                                             Mountpoint
  devtmpfs    908M   0% devtmpfs rw,nosuid,size=929264k,nr_inodes=232316,mode=755 /dev
  /dev/vda1   240M  49% ext4     rw,relatime,data=ordered                         /boot
  /dev/vda2    28G   5% xfs      rw,relatime,attr2,inode64,noquota                /
  tmpfs       184M   0% tmpfs    rw,nosuid,nodev                                  /run/user/0
  tmpfs       184M   0% tmpfs    rw,nosuid,nodev,mode=755                         /run/user/0
  tmpfs       184M   0% tmpfs    rw,nosuid,nodev,relatime,size=188224k,mode=700   /run/user/0
  tmpfs       184M   0% tmpfs    ro,nosuid,nodev,noexec,mode=755                  /run/user/0
  tmpfs       920M   0% tmpfs    rw,nosuid,nodev                                  /dev/shm
  tmpfs       920M   0% tmpfs    rw,nosuid,nodev,mode=755                         /dev/shm
  tmpfs       920M   0% tmpfs    rw,nosuid,nodev,relatime,size=188224k,mode=700   /dev/shm
  tmpfs       920M   0% tmpfs    ro,nosuid,nodev,noexec,mode=755                  /dev/shm
  tmpfs       920M   0% tmpfs    rw,nosuid,nodev                                  /sys/fs/cgroup
  tmpfs       920M   0% tmpfs    rw,nosuid,nodev,mode=755                         /sys/fs/cgroup
  tmpfs       920M   0% tmpfs    rw,nosuid,nodev,relatime,size=188224k,mode=700   /sys/fs/cgroup
  tmpfs       920M   0% tmpfs    ro,nosuid,nodev,noexec,mode=755                  /sys/fs/cgroup
  tmpfs       920M   1% tmpfs    rw,nosuid,nodev                                  /run
  tmpfs       920M   1% tmpfs    rw,nosuid,nodev,mode=755                         /run
  tmpfs       920M   1% tmpfs    rw,nosuid,nodev,relatime,size=188224k,mode=700   /run
  tmpfs       920M   1% tmpfs    ro,nosuid,nodev,noexec,mode=755                  /run
# Disk Schedulers And Queue Size #############################
         vda | [mq-deadline] 256
# Disk Partioning ############################################
Device       Type      Start        End               Size
============ ==== ========== ========== ==================
/dev/vda     Disk                              30000807936
/dev/vda1    Part       2048     526335          268434944
/dev/vda2    Part     526336   58595327        29731323392
# Kernel Inode State #########################################
dentry-state | 51065	39983	45	0	0	0
     file-nr | 896	0	183677
    inode-nr | 22926	292
# LVM Volumes ################################################
Unable to collect information
# LVM Volume Groups ##########################################
Unable to collect information
# RAID Controller ############################################
  Controller | No RAID controller detected
# Network Config #############################################
  Controller | Red Hat, Inc. Virtio network device
 FIN Timeout | 60
  Port Range | 60999
# Interface Statistics #######################################
  interface  rx_bytes rx_packets  rx_errors   tx_bytes tx_packets  tx_errors
  ========= ========= ========== ========== ========== ========== ==========
  lo                0          0          0          0          0          0
  eth0       45000000      20000          0     900000       6000          0
# Network Devices ############################################
  Device    Speed     Duplex
  ========= ========= =========
  eth0
# Top Processes ##############################################
  PID USER      PR  NI    VIRT    RES    SHR S %CPU %MEM     TIME+ COMMAND
    1 root      20   0   43408   3692   2472 S  0,0  0,2   0:00.81 systemd
    2 root      20   0       0      0      0 S  0,0  0,0   0:00.00 kthreadd
    3 root      20   0       0      0      0 S  0,0  0,0   0:00.07 ksoftirqd/0
    5 root       0 -20       0      0      0 S  0,0  0,0   0:00.00 kworker/0:0H
    6 root      20   0       0      0      0 S  0,0  0,0   0:00.02 kworker/u2:0
    7 root      rt   0       0      0      0 S  0,0  0,0   0:00.00 migration/0
    8 root      20   0       0      0      0 S  0,0  0,0   0:00.00 rcu_bh
    9 root      20   0       0      0      0 S  0,0  0,0   0:00.50 rcu_sched
   10 root       0 -20       0      0      0 S  0,0  0,0   0:00.00 lru-add-dra+
# Notable Processes ##########################################
  PID    OOM    COMMAND
  940    -17    sshd
# Memory mamagement ##########################################
Transparent huge pages are enabled.
# The End ####################################################

Starting tests:
====================================================
====================================================

DD:
====================================================
dd if=/dev/zero of=test bs=64k count=16k conv=fdatasync 2>&1
rm -f test
-----------
16384+0 записей получено
16384+0 записей отправлено
 скопировано 1073741824 байта (1,1 GB), 5,32246 c, 202 MB/c
16384+0 записей получено
16384+0 записей отправлено
 скопировано 1073741824 байта (1,1 GB), 3,8255 c, 281 MB/c
16384+0 записей получено
16384+0 записей отправлено
 скопировано 1073741824 байта (1,1 GB), 3,72877 c, 288 MB/c

Sysbench CPU:
====================================================
sysbench cpu --cpu-max-prime=20000 --num-threads=1 run
-----------
sysbench 1.0.17 (using system LuaJIT 2.0.4)

Running the test with following options:
Number of threads: 1
Initializing random number generator from current time


Prime numbers limit: 20000

Initializing worker threads...

Threads started!

CPU speed:
    events per second:   292.42

General statistics:
    total time:                          10.0008s
    total number of events:              2925

Latency (ms):
         min:                                    2.76
         avg:                                    3.42
         max:                                   32.72
         95th percentile:                        4.74
         sum:                                 9990.46

Threads fairness:
    events (avg/stddev):           2925.0000/0.00
    execution time (avg/stddev):   9.9905/0.00


Sysbench CPU Mutex 64:
====================================================
sysbench mutex --threads=64 run
-----------
sysbench 1.0.17 (using system LuaJIT 2.0.4)

Running the test with following options:
Number of threads: 64
Initializing random number generator from current time


Initializing worker threads...

Threads started!


General statistics:
    total time:                          11.7283s
    total number of events:              64

Latency (ms):
         min:                                10429.69
         avg:                                11152.47
         max:                                11718.03
         95th percentile:                    11523.48
         sum:                               713758.10

Threads fairness:
    events (avg/stddev):           1.0000/0.00
    execution time (avg/stddev):   11.1525/0.26


Memory size for Sysbench Memory test: 1G
Disk space for Sysbench Disk test: 2G
Sysbench Memory test:
====================================================
sysbench memory --num-threads=4 --memory-total-size=1G run
-----------
WARNING: --num-threads is deprecated, use --threads instead
sysbench 1.0.17 (using system LuaJIT 2.0.4)

Running the test with following options:
Number of threads: 4
Initializing random number generator from current time


Running memory speed test with the following options:
  block size: 1KiB
  total size: 1024MiB
  operation: write
  scope: global

Initializing worker threads...

Threads started!

Total operations: 1048576 (3009825.17 per second)

1024.00 MiB transferred (2939.28 MiB/sec)


General statistics:
    total time:                          0.3444s
    total number of events:              1048576

Latency (ms):
         min:                                    0.00
         avg:                                    0.00
         max:                                   69.03
         95th percentile:                        0.00
         sum:                                  588.27

Threads fairness:
    events (avg/stddev):           262144.0000/0.00
    execution time (avg/stddev):   0.1471/0.07


Sysbench Disk test:
====================================================
sysbench fileio --file-total-size=2G prepare
-----------
sysbench 1.0.17 (using system LuaJIT 2.0.4)

128 files, 16384Kb each, 2048Mb total
Creating files for the test...
Extra file open flags: (none)
Creating file test_file.0
...
Creating file test_file.127
2147483648 bytes written in 10.67 seconds (191.89 MiB/sec).
sysbench fileio --file-total-size=2G --file-test-mode=rndrw --time=300 --max-requests=0 run
-----------
sysbench 1.0.17 (using system LuaJIT 2.0.4)

Running the test with following options:
Number of threads: 1
Initializing random number generator from current time


Extra file open flags: (none)
128 files, 16MiB each
2GiB total file size
Block size 16KiB
Number of IO requests: 0
Read/Write ratio for combined random IO test: 1.50
Periodic FSYNC enabled, calling fsync() each 100 requests.
Calling fsync() at the end of test, Enabled.
Using synchronous I/O mode
Doing random r/w test
Initializing worker threads...

Threads started!


File operations:
    reads/s:                      930.29
    writes/s:                     620.19
    fsyncs/s:                     1984.62

Throughput:
    read, MiB/s:                  14.54
    written, MiB/s:               9.69

General statistics:
    total time:                          300.0977s
    total number of events:              1060758

Latency (ms):
         min:                                    0.00
         avg:                                    0.28
         max:                                  138.03
         95th percentile:                        1.01
         sum:                               296838.96

Threads fairness:
    events (avg/stddev):           1060758.0000/0.00
    execution time (avg/stddev):   296.8390/0.00


Speedtest cli:
====================================================
speedtest-cli
-----------
Retrieving speedtest.net configuration...
Testing from Argotel ANTIDDOS-HOSTING (95.182.122.xxx)...
Retrieving speedtest.net server list...
Selecting best server based on ping...
Hosted by Net By Net Holding LLC (Moscow) [0.12 km]: 3.679 ms
Testing download speed................................................................................
Download: 4.34 Mbit/s
Testing upload speed....................................................................................................
Upload: 2.91 Mbit/s

7-zip benchmark:
====================================================
7za b
-----------

7-Zip (a) [64] 16.02 : Copyright (c) 1999-2016 Igor Pavlov : 2016-05-21
p7zip Version 16.02 (locale=ru_RU.UTF-8,Utf16=on,HugeFiles=on,64 bits,1 CPU QEMU Virtual CPU version 2.5+ (6D3),ASM)

QEMU Virtual CPU version 2.5+ (6D3)
CPU Freq:  3267  3271  2366  1579  3231  3335  3141  3119  3430

RAM size:    1838 MB,  # CPU hardware threads:   1
RAM usage:    435 MB,  # Benchmark threads:      1

                       Compressing  |                  Decompressing
Dict     Speed Usage    R/U Rating  |      Speed Usage    R/U Rating
         KiB/s     %   MIPS   MIPS  |      KiB/s     %   MIPS   MIPS

22:       2221    95   2267   2161  |      31816    95   2872   2717
23:       2576   100   2637   2625  |      34007   100   2945   2944
24:       1893    97   2108   2036  |      28545    94   2652   2506
25:       1548    95   1861   1768  |      29503    97   2706   2626
----------------------------------  | ------------------------------
Avr:              97   2218   2147  |               97   2794   2698
Tot:              97   2506   2423
Выводы:
Решил сравнить ключевые параметры сервера с похожими конфигурациями других хостеров.
- /2018/11/beget-vps-prime/ - 660 рублей в месяц
- /2018/01/hetzner-cloud/ - ~210 рублей в месяц
CPU Mhz (больше лучше)
3299.998 vs 2199.994 (beget) vs 2100.000 (hetzner)

Скорость линейной записи на диск через dd (больше лучше)
~250 MB/c vs ~350 MB/s (beget) vs ~430 MB/s (hetzner)

sysbench --test=cpu --cpu-max-prime=20000 --num-threads=1 run (больше лучше)
2925 vs 3379 (beget) vs 3657 (hetzner)

sysbench --test=mutex --num-threads=64 run (больше лучше)
11.7283s vs 6.1926s (beget) vs 11.6644s (hetzner)

sysbench memory --num-threads=4 --memory-total-size=2G run (меньше лучше)
0.3444s vs 0.1999s (beget) vs 0.7827s (hetzner)

sysbench fileio --file-total-size=4G --file-test-mode=rndrw --time=300 --max-requests=0 run (больше лучше)
read, MiB/s: 14.54, written, MiB/s: 9.69 vs read, MiB/s: 16.27, written, MiB/s: 10.84 (beget) vs read, MiB/s: 29.33, written, MiB/s: 19.55 (hetzner)

Пинг из Ульяновска
20.771 ms vs 28.371 ms (beget) vs 64.429 ms (hetzner)
Тут опять же, сервер в Hetzner дешевле, но сравнимый по мощности сервер в России подороже. Такой сервер у Hosting-russia стоит 250 рублей в месяц.
IP-адреса
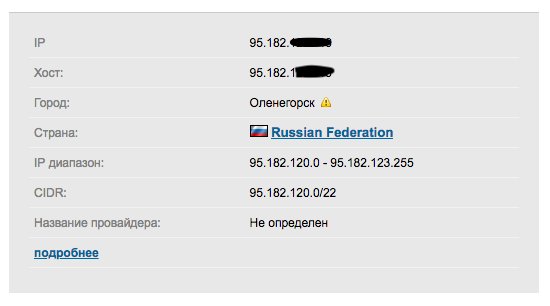
Сервис 2ip почему-то определяет местоположение этого адреса в Оленегорске. Но сервера в Москве.
Пинг из Ульяновска
~: ping 95.182.122.xxx
PING 95.182.122.xxx (95.182.122.xxx): 56 data bytes
64 bytes from 95.182.122.xxx: icmp_seq=0 ttl=57 time=18.058 ms
64 bytes from 95.182.122.xxx: icmp_seq=1 ttl=57 time=20.918 ms
64 bytes from 95.182.122.xxx: icmp_seq=2 ttl=57 time=17.807 ms
64 bytes from 95.182.122.xxx: icmp_seq=3 ttl=57 time=16.925 ms
64 bytes from 95.182.122.xxx: icmp_seq=4 ttl=57 time=20.771 ms
64 bytes from 95.182.122.xxx: icmp_seq=5 ttl=57 time=17.091 ms
64 bytes from 95.182.122.xxx: icmp_seq=6 ttl=57 time=23.444 ms
64 bytes from 95.182.122.xxx: icmp_seq=7 ttl=57 time=18.017 ms
64 bytes from 95.182.122.xxx: icmp_seq=8 ttl=57 time=17.791 ms
64 bytes from 95.182.122.xxx: icmp_seq=9 ttl=57 time=19.555 ms
64 bytes from 95.182.122.xxx: icmp_seq=10 ttl=57 time=17.942 ms
^C
--- 95.182.122.xxx ping statistics ---
11 packets transmitted, 11 packets received, 0.0% packet loss
round-trip min/avg/max/stddev = 16.925/18.938/23.444/1.922 ms
Выводы
В целом пока неплохо. Хорошо для серверов предназначенных для веб-разработки. Какой-то серьезный продакшн я бы здесь размещать пока не стал в силу того что сервис новый. Но вот тестовые сервера тут думаю будут себя чувствовать прекрасно)